 Magnitudes and luminosities#
This page shows the public magnitude and luminosity helper namespaces attached
to lfkit.LuminosityFunction.
The examples use the lf.magnitudes and lf.luminosities namespaces, plus
lfkit.LuminosityFunction.phi_from_m() for evaluating a luminosity function
from apparent magnitude.
These helpers are useful when a workflow needs to connect apparent magnitude, absolute magnitude, luminosity distance, and luminosity ratios before applying luminosity function calculations.
Completeness calculations and survey magnitude limits are covered on a separate page.
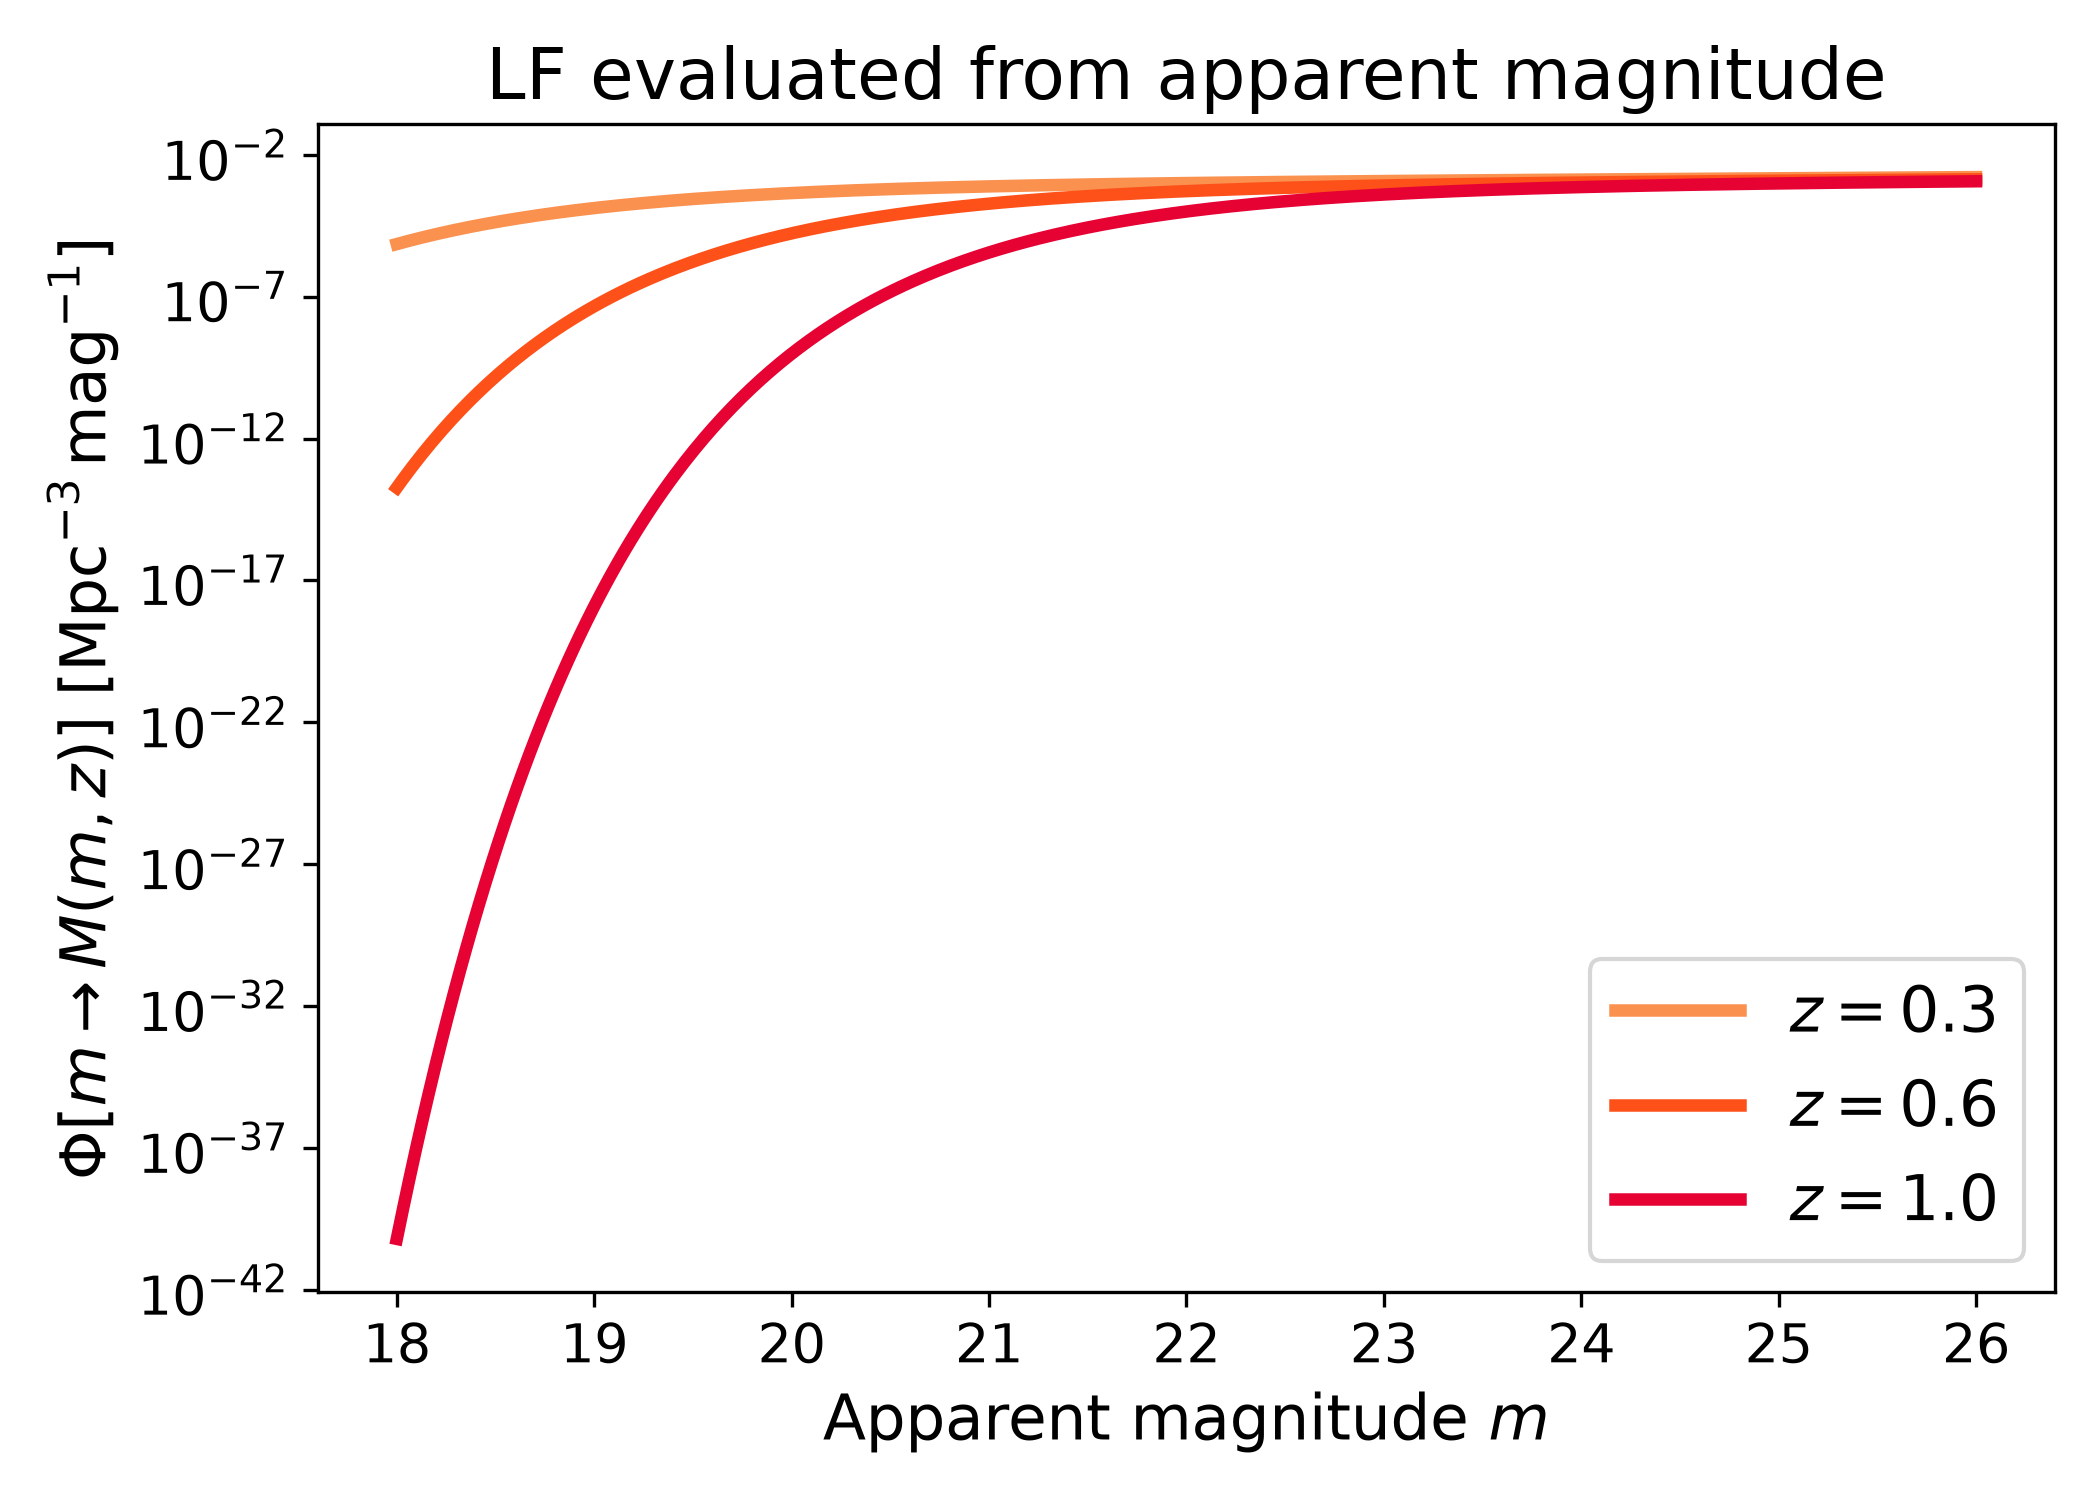
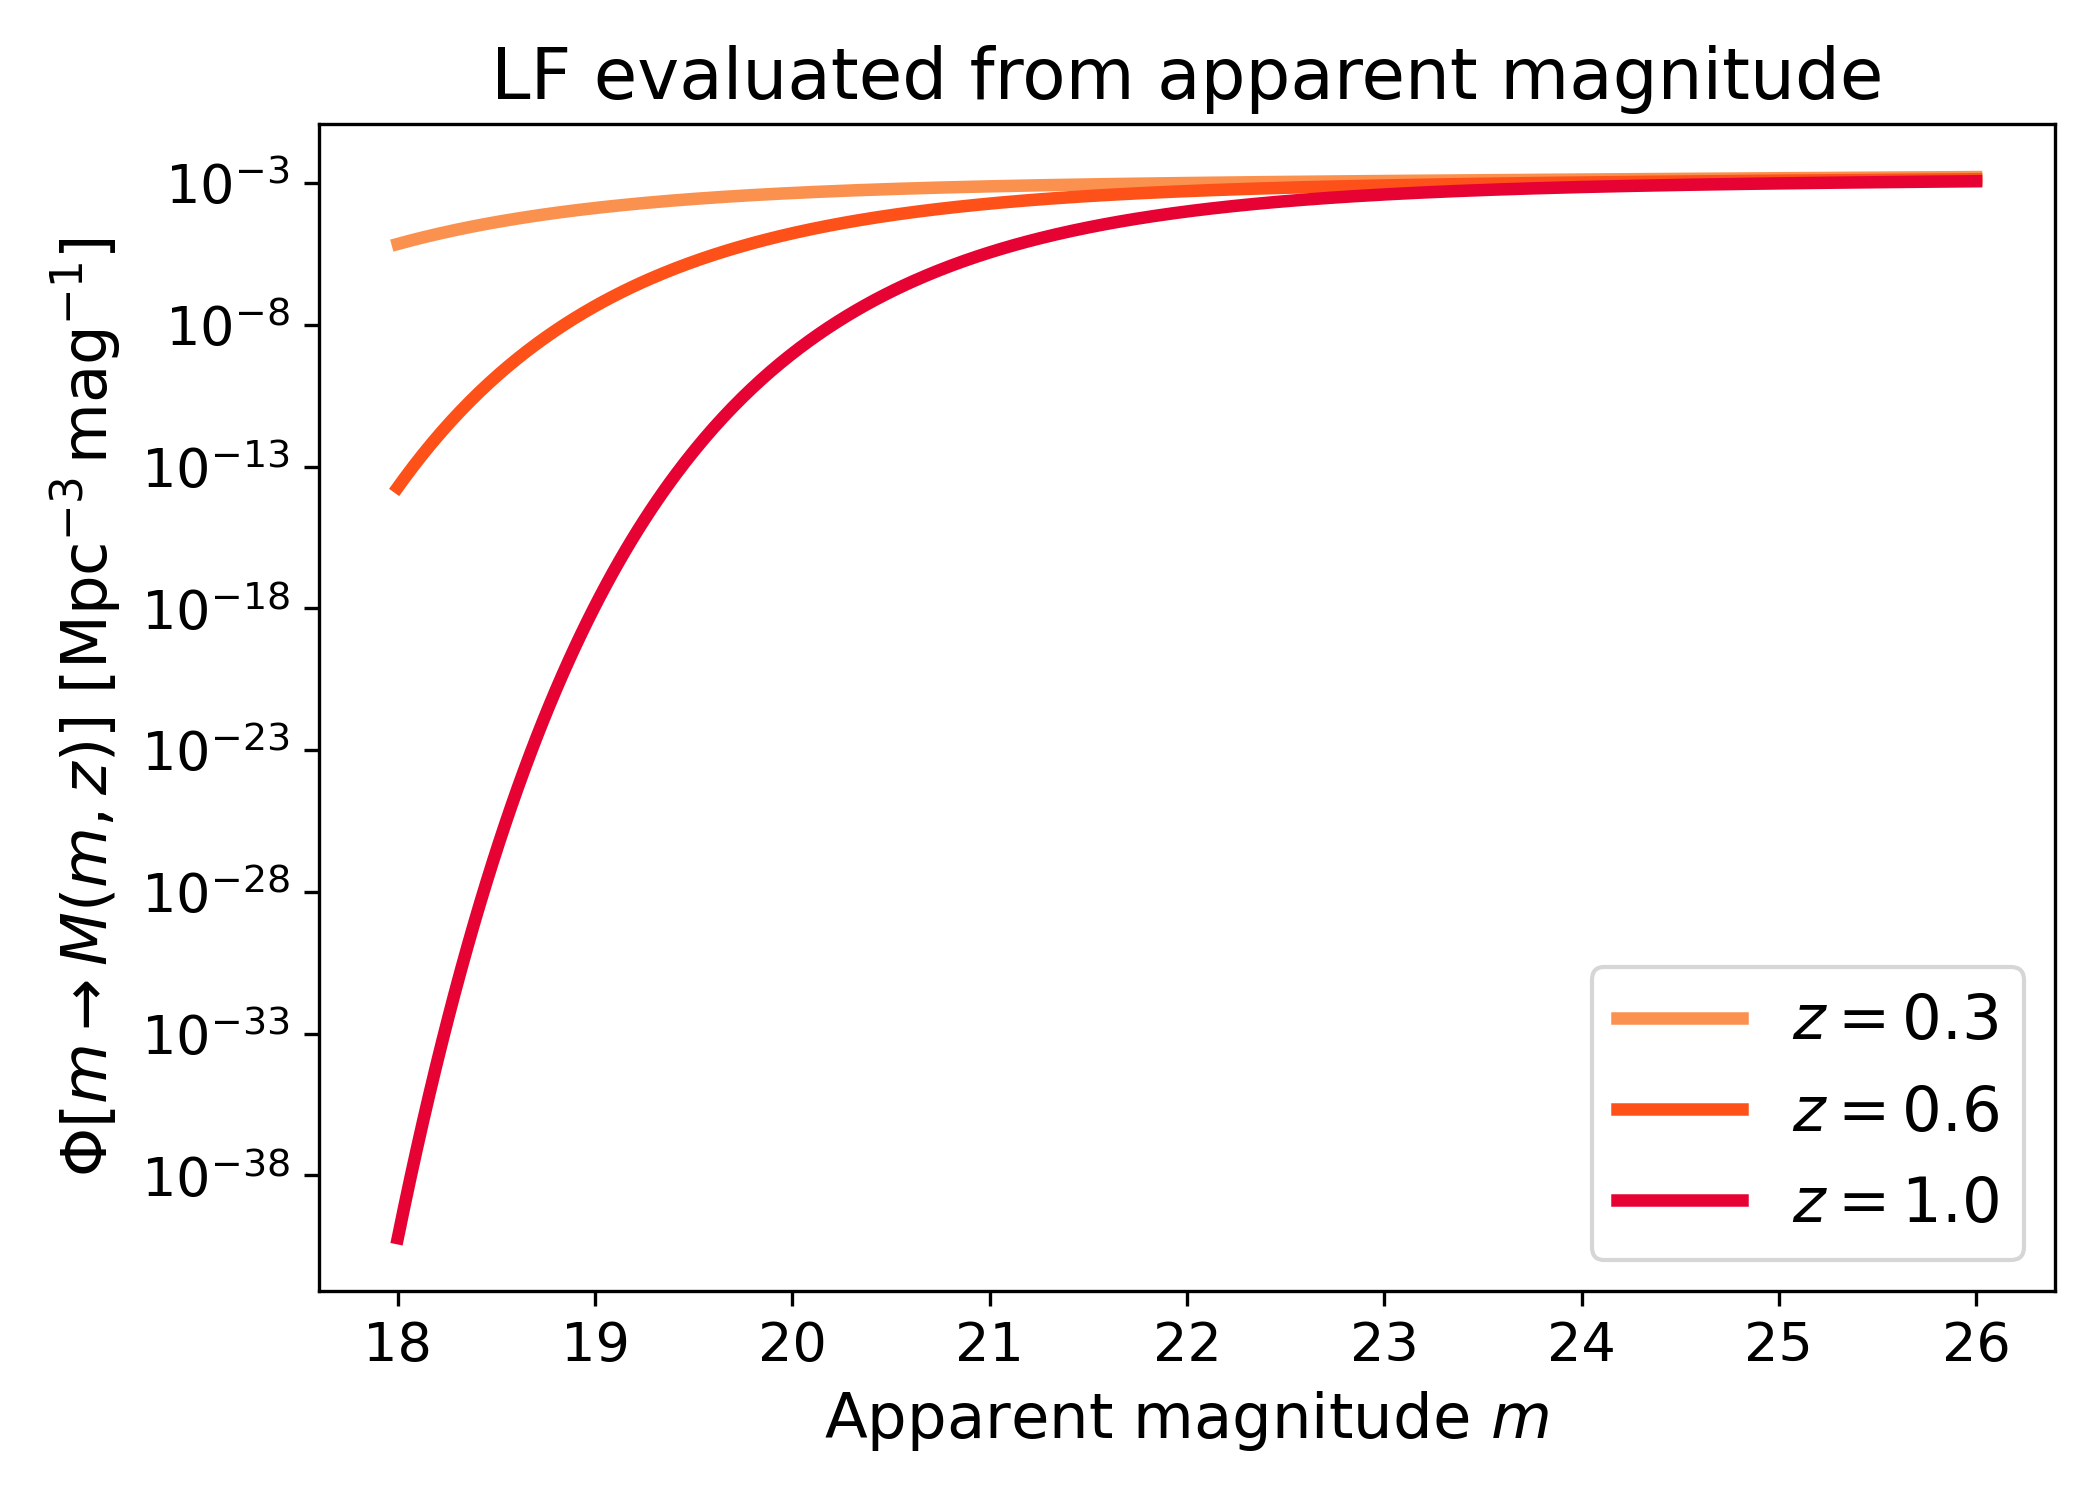
LF from apparent magnitude#
For models with apparent magnitude support,
lfkit.LuminosityFunction.phi_from_m() converts apparent magnitude to
absolute magnitude and evaluates the luminosity function.
This is useful when the natural input is an observed apparent magnitude rather than an intrinsic absolute magnitude.
import numpy as np
import matplotlib.pyplot as plt
import cmasher as cmr
import pyccl as ccl

from lfkit import LuminosityFunction

LABEL_SIZE = 15
TICK_SIZE = 13
TITLE_SIZE = 17
LEGEND_SIZE = 15

cosmo = ccl.Cosmology(
    Omega_c=0.25,
    Omega_b=0.05,
    h=0.7,
    sigma8=0.8,
    n_s=0.96,
    transfer_function="bbks",
    matter_power_spectrum="linear",
)

lf = LuminosityFunction.schechter(
    phi_star=1.0e-3,
    m_star=-20.5,
    alpha=-1.1,
)

apparent_mag = np.linspace(18.0, 26.0, 500)
redshifts = [0.3, 0.6, 1.0]
colors = cmr.take_cmap_colors(
        "cmr.guppy",
        len(redshifts),
        cmap_range=(0.0, 0.2),
    )

fig, ax = plt.subplots(figsize=(7.0, 5.0))

for z_value, color in zip(redshifts, colors):
    phi = lf.phi_from_m(
        cosmo,
        z_value,
        apparent_mag,
        h=0.7,
    )
    ax.plot(apparent_mag, phi, lw=3, color=color, label=rf"$z={z_value}$")

ax.set_yscale("log")
ax.set_xlabel("Apparent magnitude $m$", fontsize=LABEL_SIZE)
ax.set_ylabel(
    r"$\Phi[m \rightarrow M(m,z)]$ [$\mathrm{Mpc}^{-3}\,\mathrm{mag}^{-1}$]",
    fontsize=LABEL_SIZE,
)
ax.set_title("LF evaluated from apparent magnitude", fontsize=TITLE_SIZE)
ax.tick_params(axis="both", labelsize=TICK_SIZE)
ax.legend(frameon=True, fontsize=LEGEND_SIZE, loc="best")
plt.tight_layout()
(png)
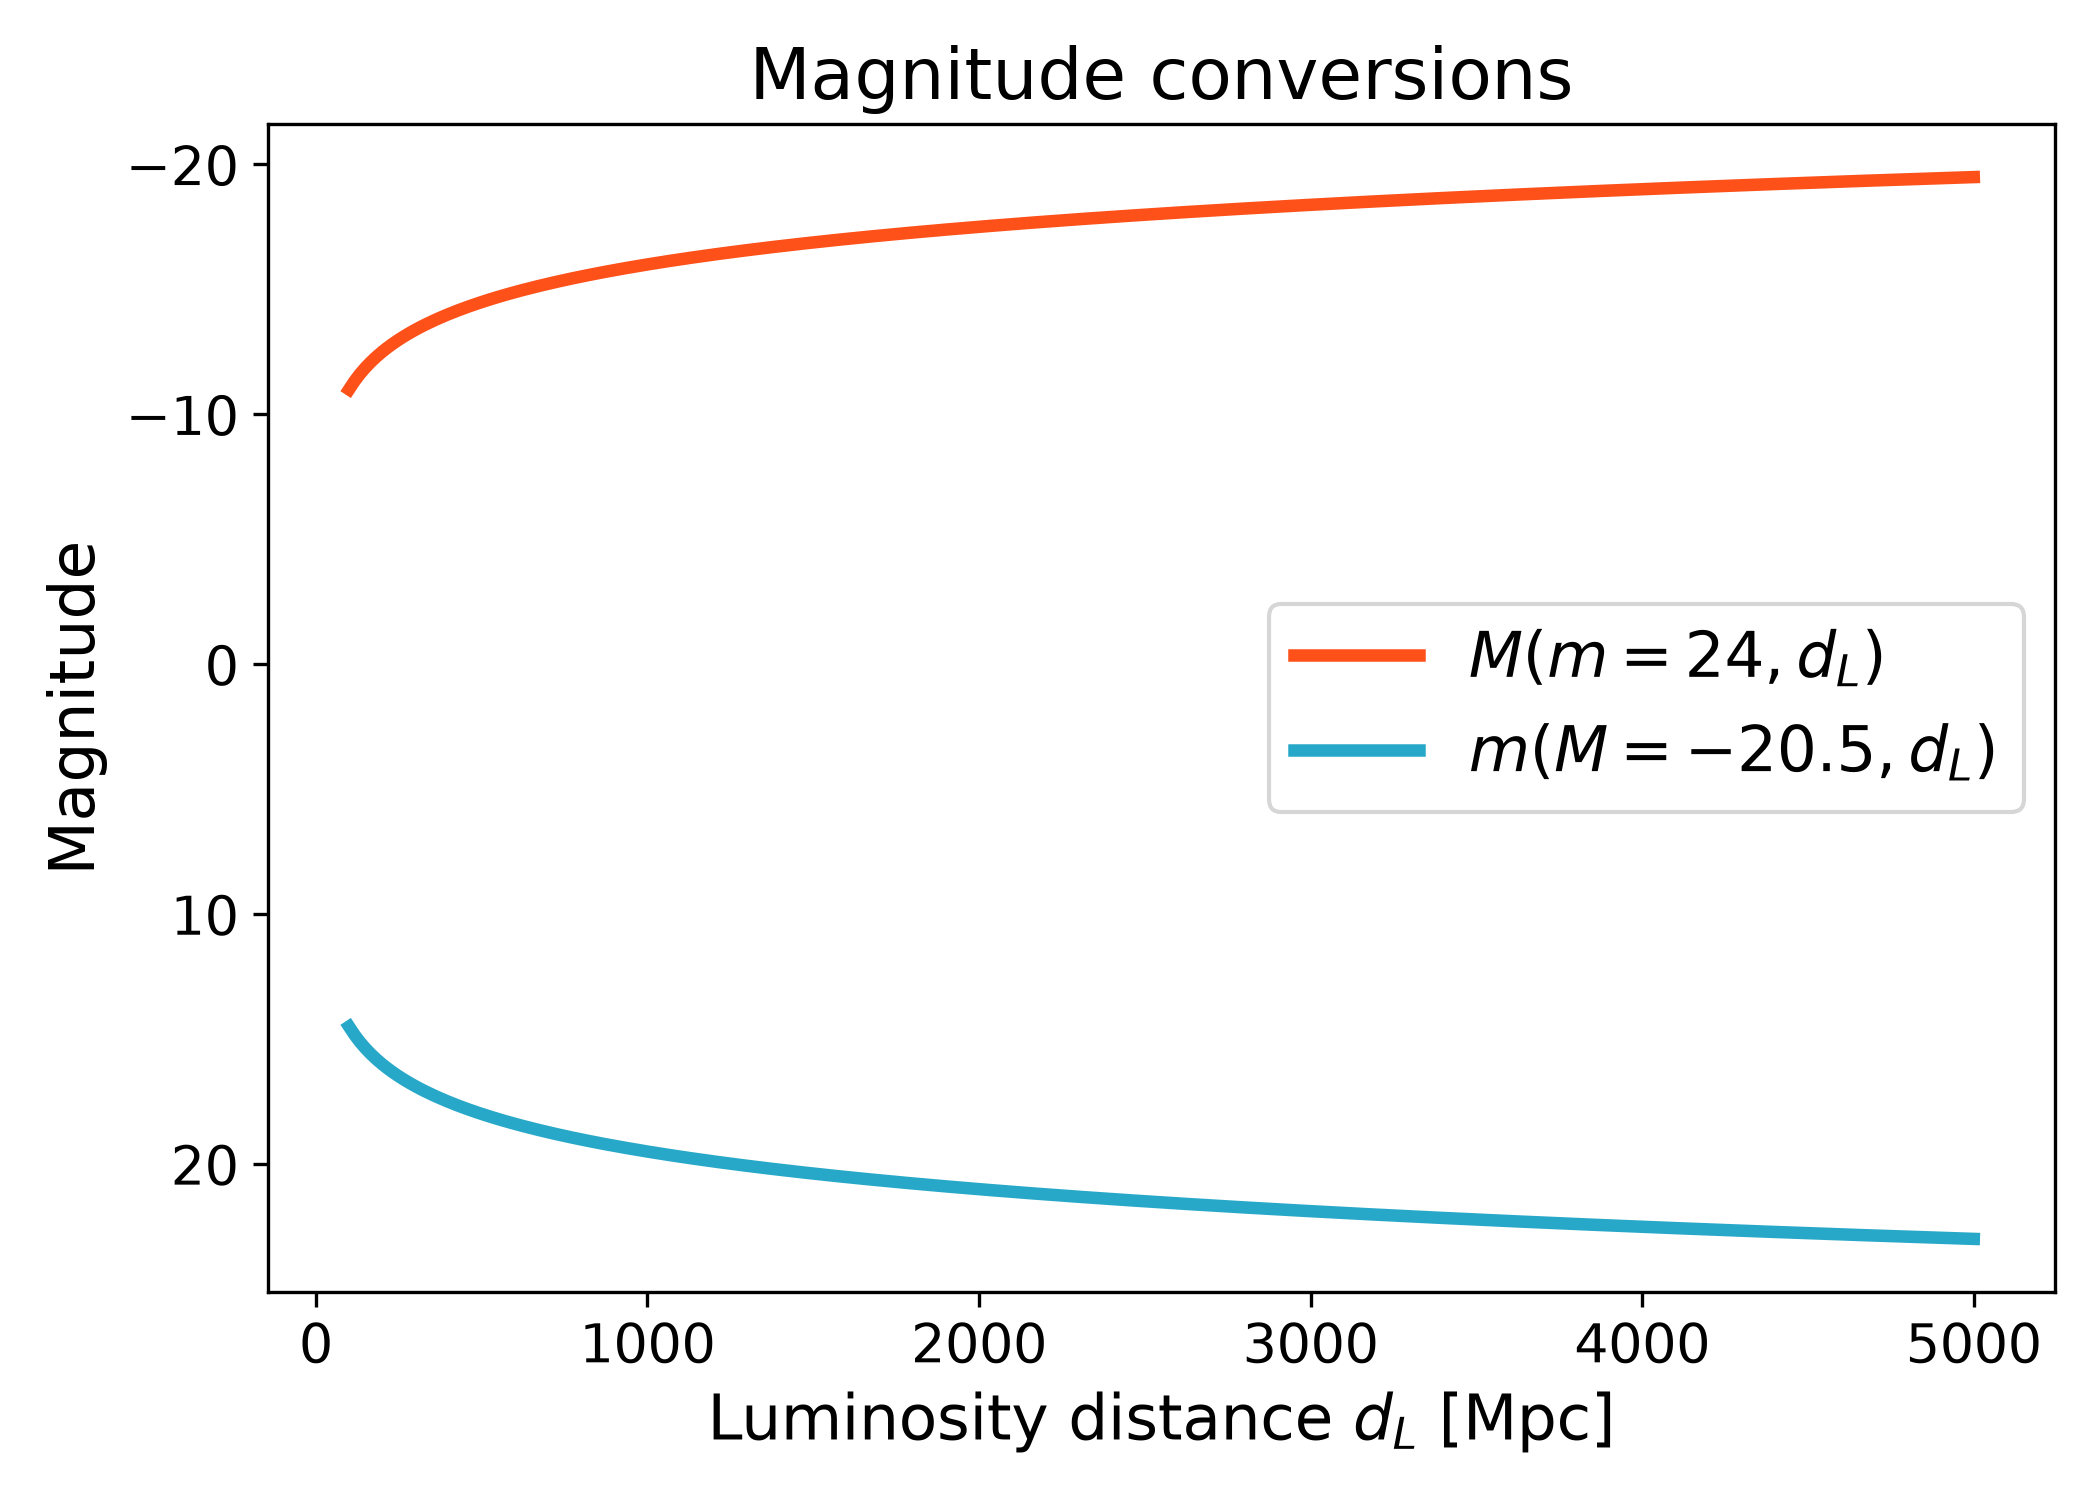
Magnitude conversions#
The magnitudes namespace provides helpers for converting between apparent
and absolute magnitude.
The luminosity-distance versions are useful when a workflow already has a distance array from another cosmology backend.
import numpy as np
import matplotlib.pyplot as plt
import cmasher as cmr

from lfkit import LuminosityFunction

LABEL_SIZE = 15
TICK_SIZE = 13
TITLE_SIZE = 17
LEGEND_SIZE = 15

lf = LuminosityFunction.schechter(
    phi_star=1.0e-3,
    m_star=-20.5,
    alpha=-1.1,
)

luminosity_distance_mpc = np.linspace(100.0, 5000.0, 300)

absolute_mag = lf.magnitudes.absolute_from_luminosity_distance(
    24.0,
    luminosity_distance_mpc,
)

apparent_mag = lf.magnitudes.apparent_from_luminosity_distance(
    -20.5,
    luminosity_distance_mpc,
)

red = cmr.take_cmap_colors("cmr.guppy", 3, cmap_range=(0.0, 0.2))[1]
blue = cmr.take_cmap_colors("cmr.guppy", 3, cmap_range=(0.8, 1.0))[1]

fig, ax = plt.subplots(figsize=(7.0, 5.0))
ax.plot(
    luminosity_distance_mpc,
    absolute_mag,
    lw=3,
    color=red,
    label=r"$M(m=24, d_L)$",
)
ax.plot(
    luminosity_distance_mpc,
    apparent_mag,
    lw=3,
    color=blue,
    label=r"$m(M=-20.5, d_L)$",
)

ax.invert_yaxis()
ax.set_xlabel(r"Luminosity distance $d_L$ [Mpc]", fontsize=LABEL_SIZE)
ax.set_ylabel("Magnitude", fontsize=LABEL_SIZE)
ax.set_title("Magnitude conversions", fontsize=TITLE_SIZE)
ax.tick_params(axis="both", labelsize=TICK_SIZE)
ax.legend(frameon=True, fontsize=LEGEND_SIZE, loc="best")
plt.tight_layout()
(png)

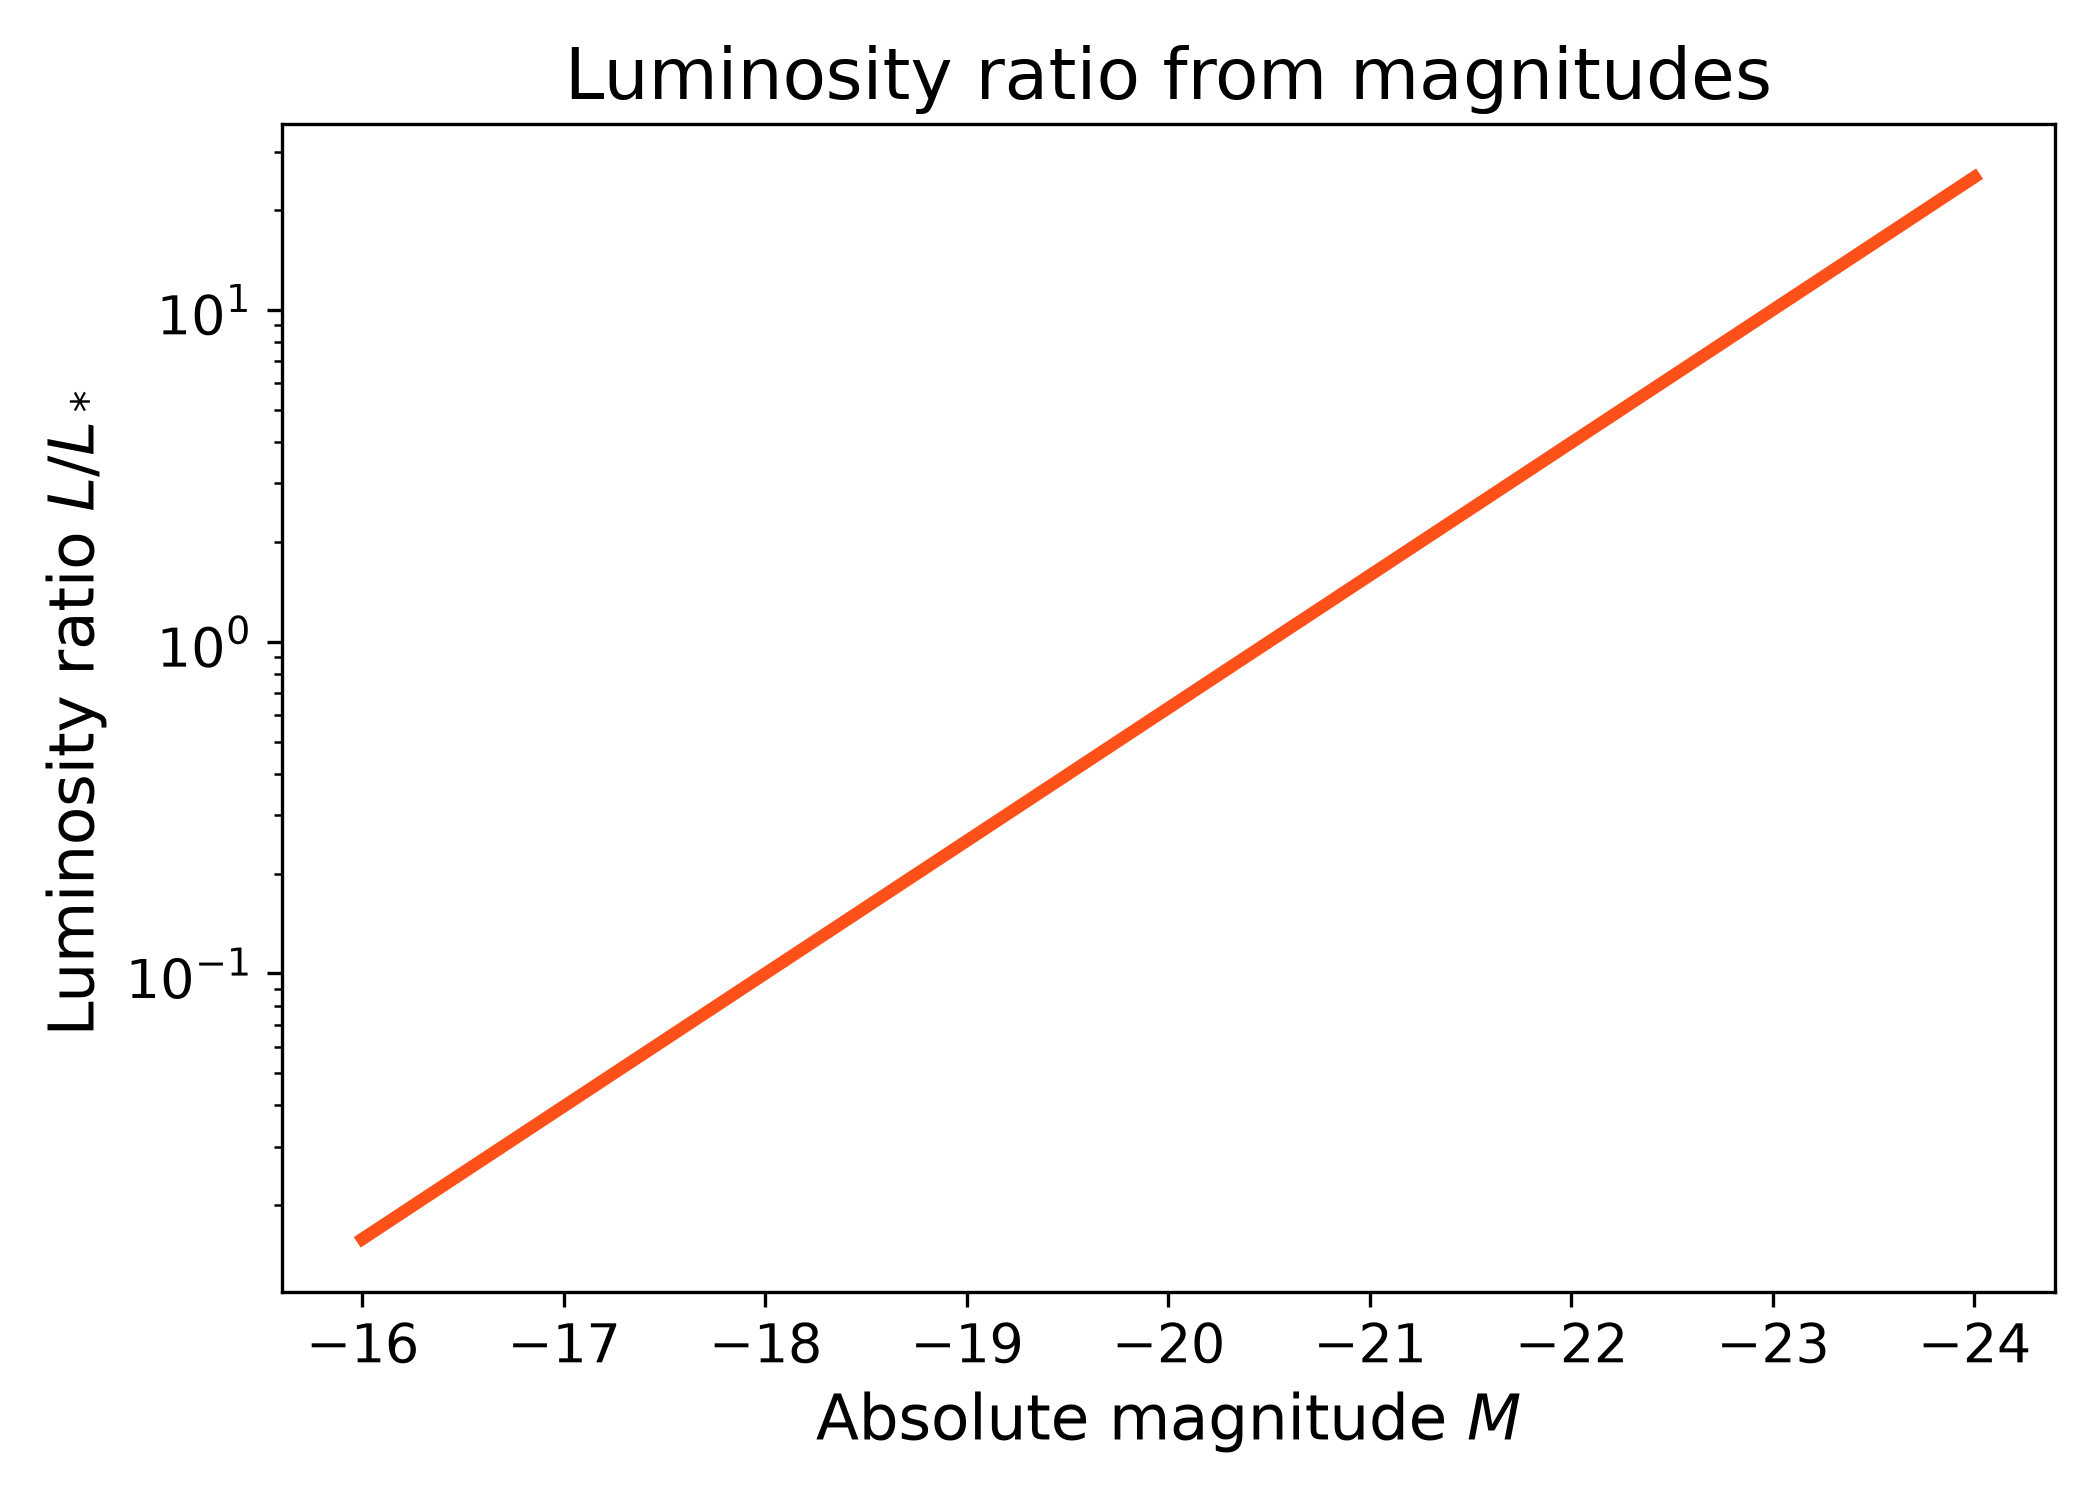
Luminosity ratio from magnitudes#
The luminosities namespace exposes helper functions for magnitude and
luminosity-ratio calculations.
This example converts absolute magnitude into the luminosity ratio \(L/L_*\). Brighter galaxies have larger luminosity ratios, so the curve increases toward more negative absolute magnitudes.
import numpy as np
import matplotlib.pyplot as plt
import cmasher as cmr

from lfkit import LuminosityFunction

LABEL_SIZE = 15
TICK_SIZE = 13
TITLE_SIZE = 17

lf = LuminosityFunction.schechter(
    phi_star=1.0e-3,
    m_star=-20.5,
    alpha=-1.1,
)

absolute_mag = np.linspace(-24.0, -16.0, 300)
luminosity_ratio = lf.luminosities.ratio_from_magnitudes(
    absolute_mag,
    -20.5,
)

fig, ax = plt.subplots(figsize=(7.0, 5.0))
ax.plot(
    absolute_mag,
    luminosity_ratio,
    lw=3,
    color=cmr.take_cmap_colors("cmr.guppy", 3, cmap_range=(0.0, 0.2))[1],
)

ax.set_yscale("log")
ax.invert_xaxis()
ax.set_xlabel("Absolute magnitude $M$", fontsize=LABEL_SIZE)
ax.set_ylabel(r"Luminosity ratio $L/L_*$", fontsize=LABEL_SIZE)
ax.set_title("Luminosity ratio from magnitudes", fontsize=TITLE_SIZE)
ax.tick_params(axis="both", labelsize=TICK_SIZE)
plt.tight_layout()
(png)
