Poggianti (1997) examples#
This page provides basic, executable examples showing how to use
lfkit.Corrections to compute k-corrections \(k(z)\),
e-corrections \(e(z)\), and their sum \(k(z)+e(z)\) using the
Poggianti (1997) backend.
All examples below are executable via .. plot::.
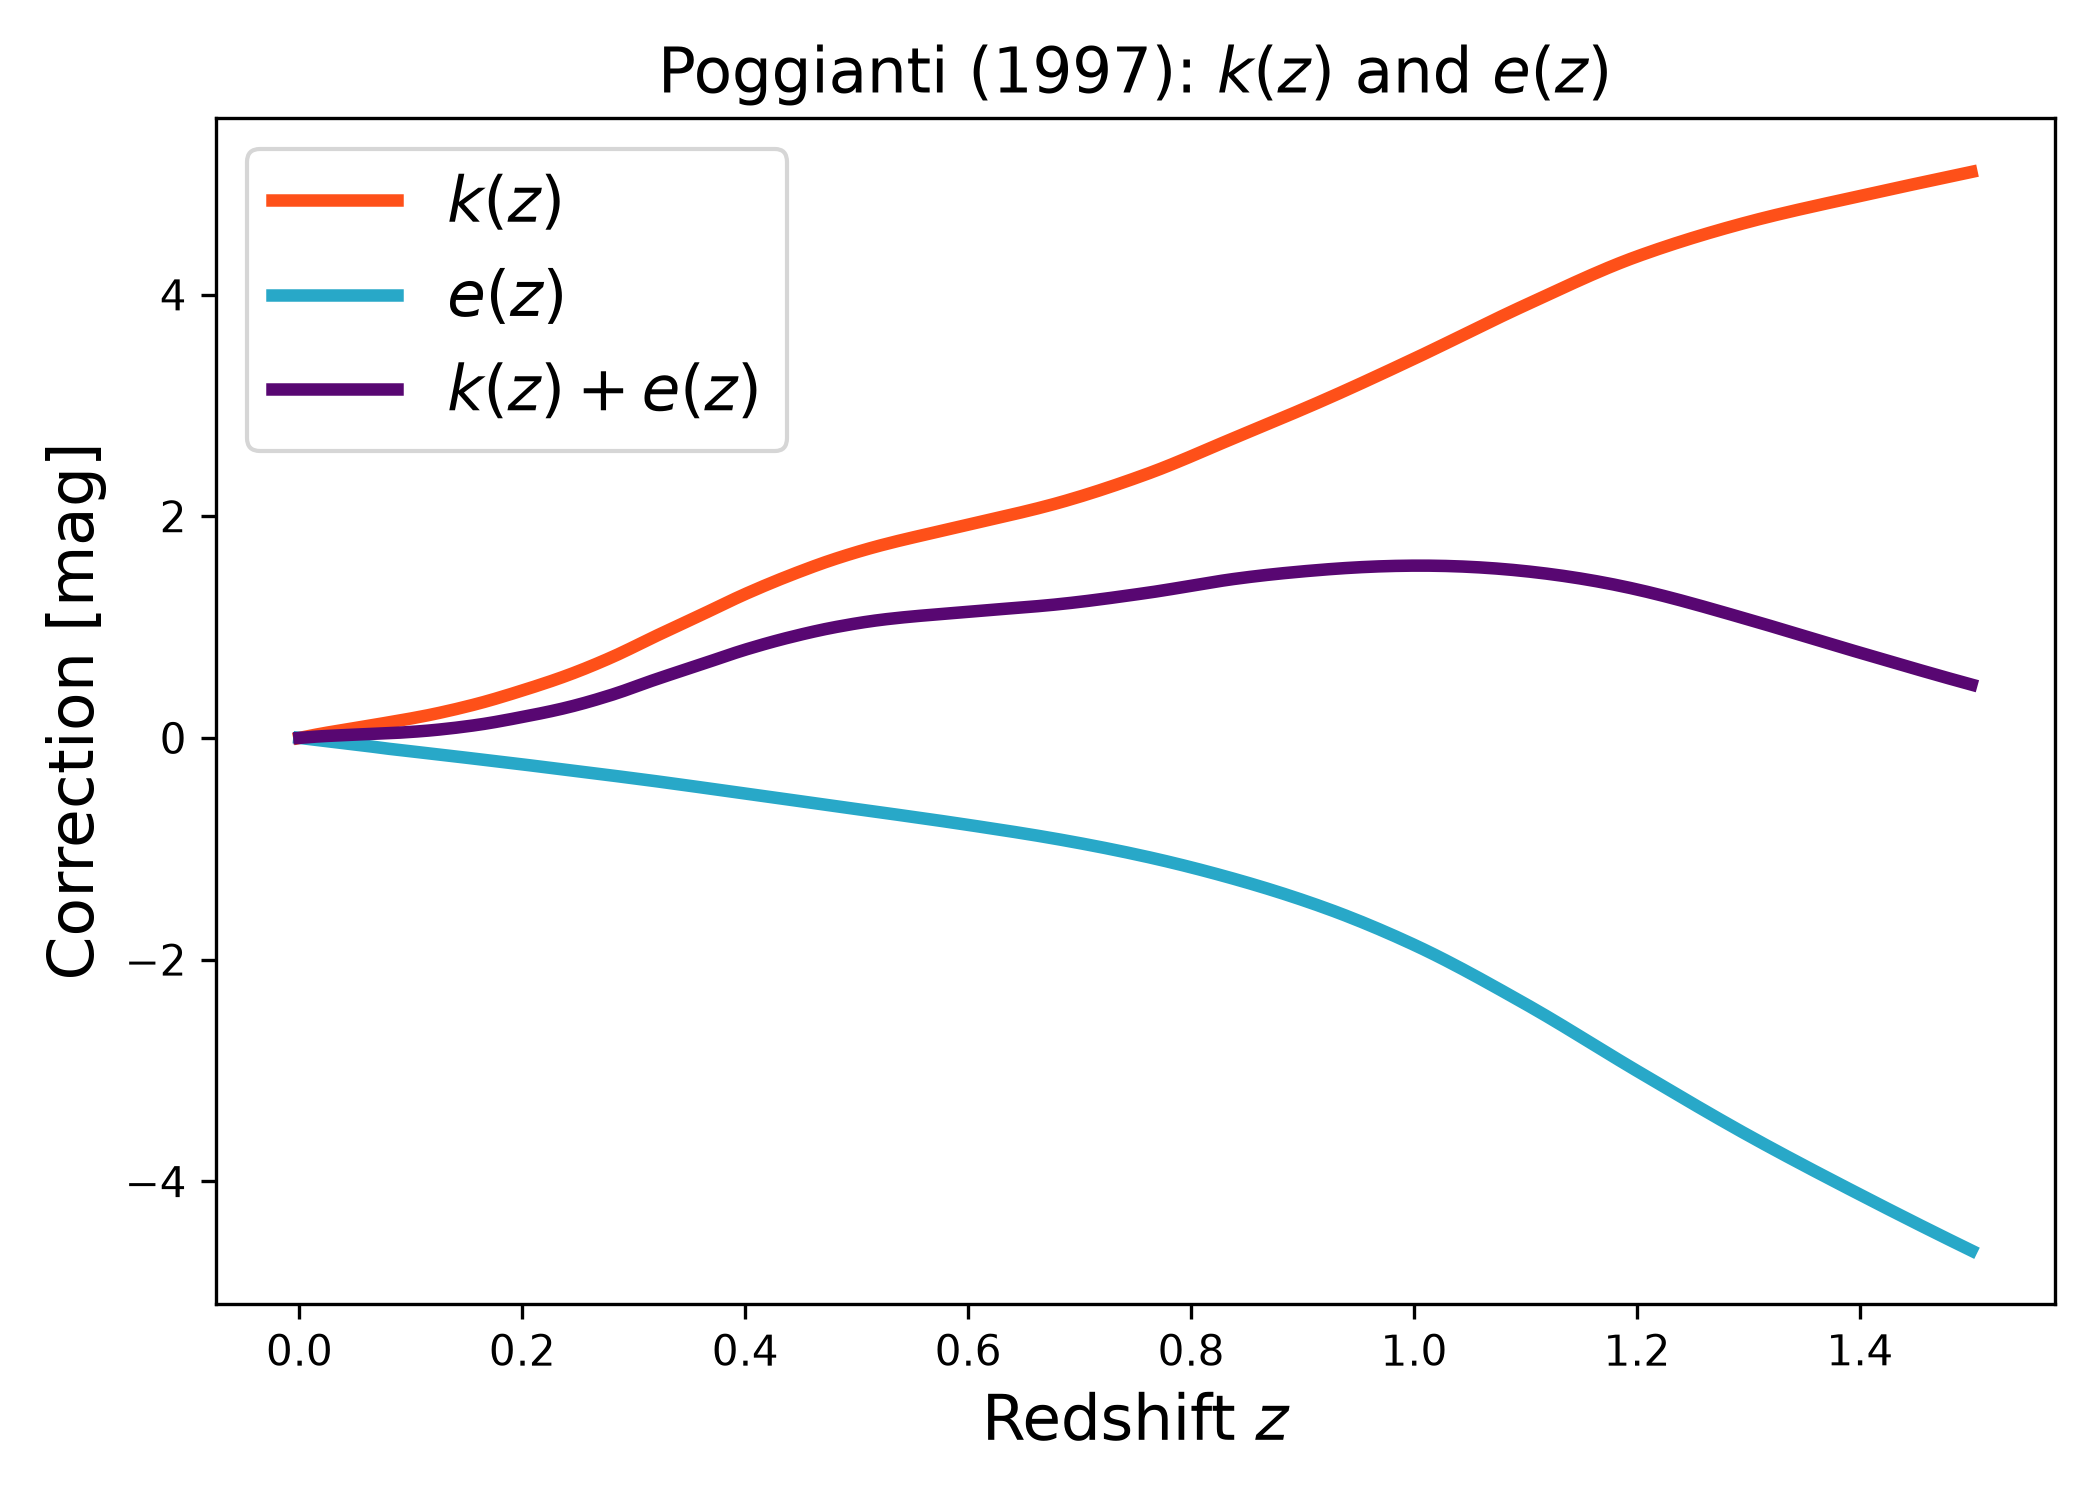
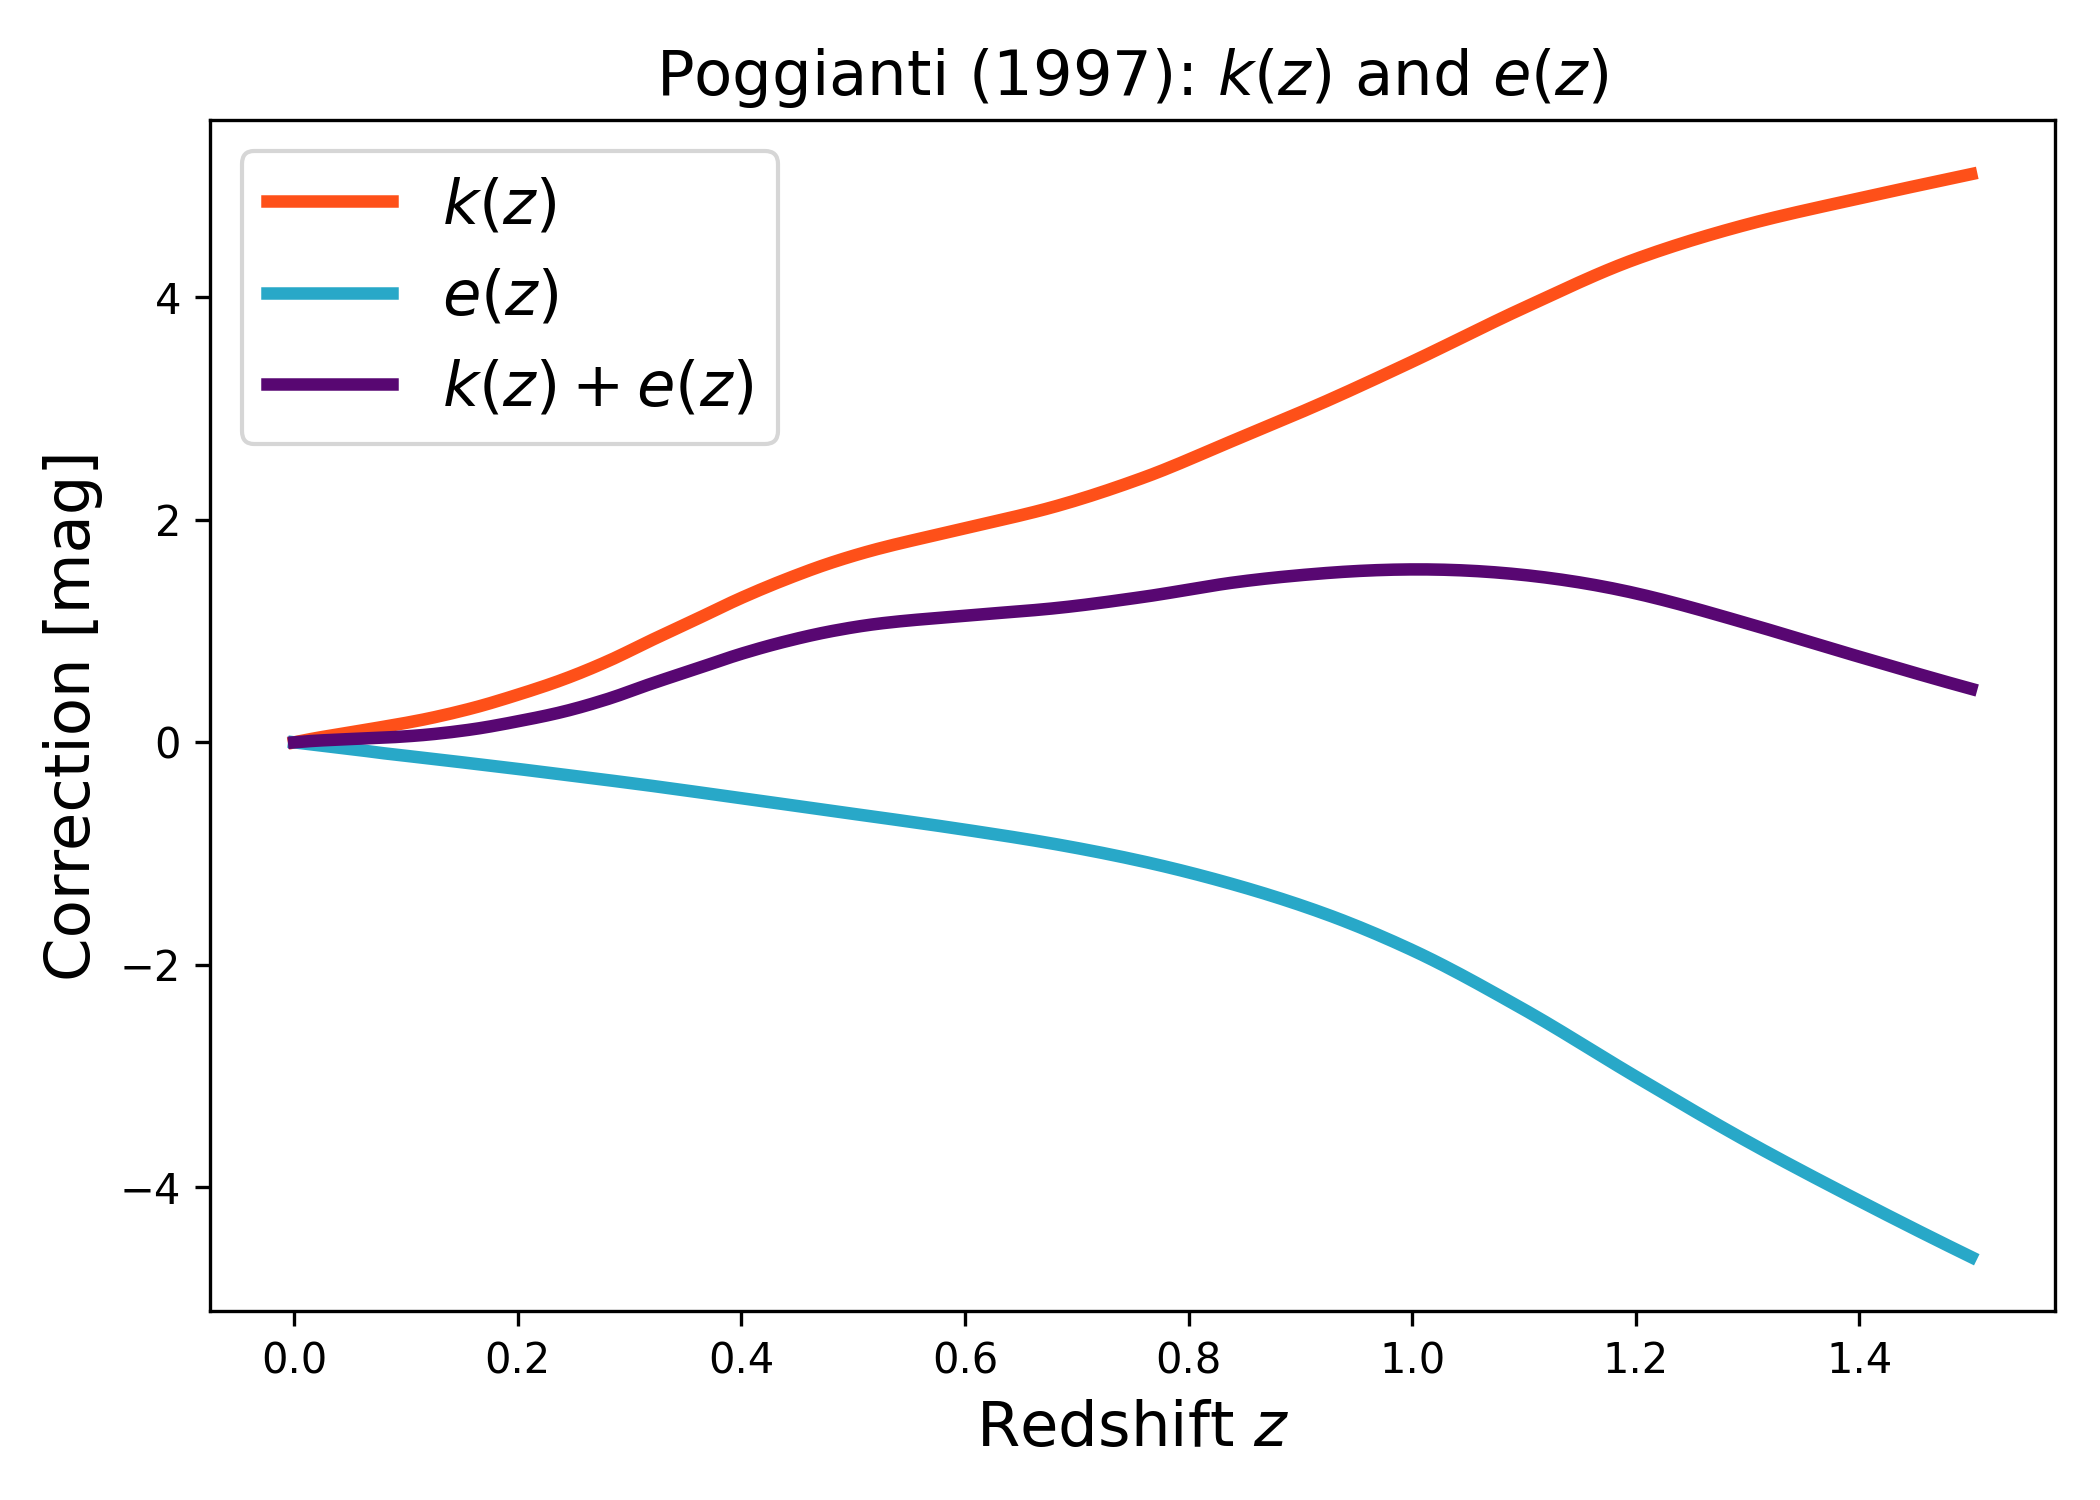
Basic Poggianti k(z), e(z), and k(z)+e(z)#
Compute \(k(z)\), \(e(z)\), and \(k(z)+e(z)\) for a single band and galaxy type.
import numpy as np
import matplotlib.pyplot as plt
import cmasher as cmr

from lfkit import Corrections

# Build a Poggianti corrections object
corr = Corrections.poggianti(band="V", gal_type="E")

z = np.linspace(0.0, 1.5, 300)
k  = corr.k(z)
e  = corr.e(z)
ke = corr.ke(z)

cmap = "cmr.guppy"
c_red    = cmr.take_cmap_colors(cmap, 3, cmap_range=(0.0, 0.2))[1]
c_blue   = cmr.take_cmap_colors(cmap, 3, cmap_range=(0.8, 1.0))[1]
c_purple = cmr.take_cmap_colors(cmap, 3, cmap_range=(0.35, 0.65))[1]

plt.figure(figsize=(7.0, 5.0))
lw = 3
fs = 15
plt.plot(z, k,  lw=lw, color=c_red,    label=r"$k(z)$")
plt.plot(z, e,  lw=lw, color=c_blue,   label=r"$e(z)$")
plt.plot(z, ke, lw=lw, color=c_purple, label=r"$k(z)+e(z)$")
plt.xlabel("Redshift $z$", fontsize=fs)
plt.ylabel("Correction [mag]", fontsize=fs)
plt.title("Poggianti (1997): $k(z)$ and $e(z)$", fontsize=fs)
plt.legend(frameon=True, fontsize=fs)
plt.tight_layout()
(png)
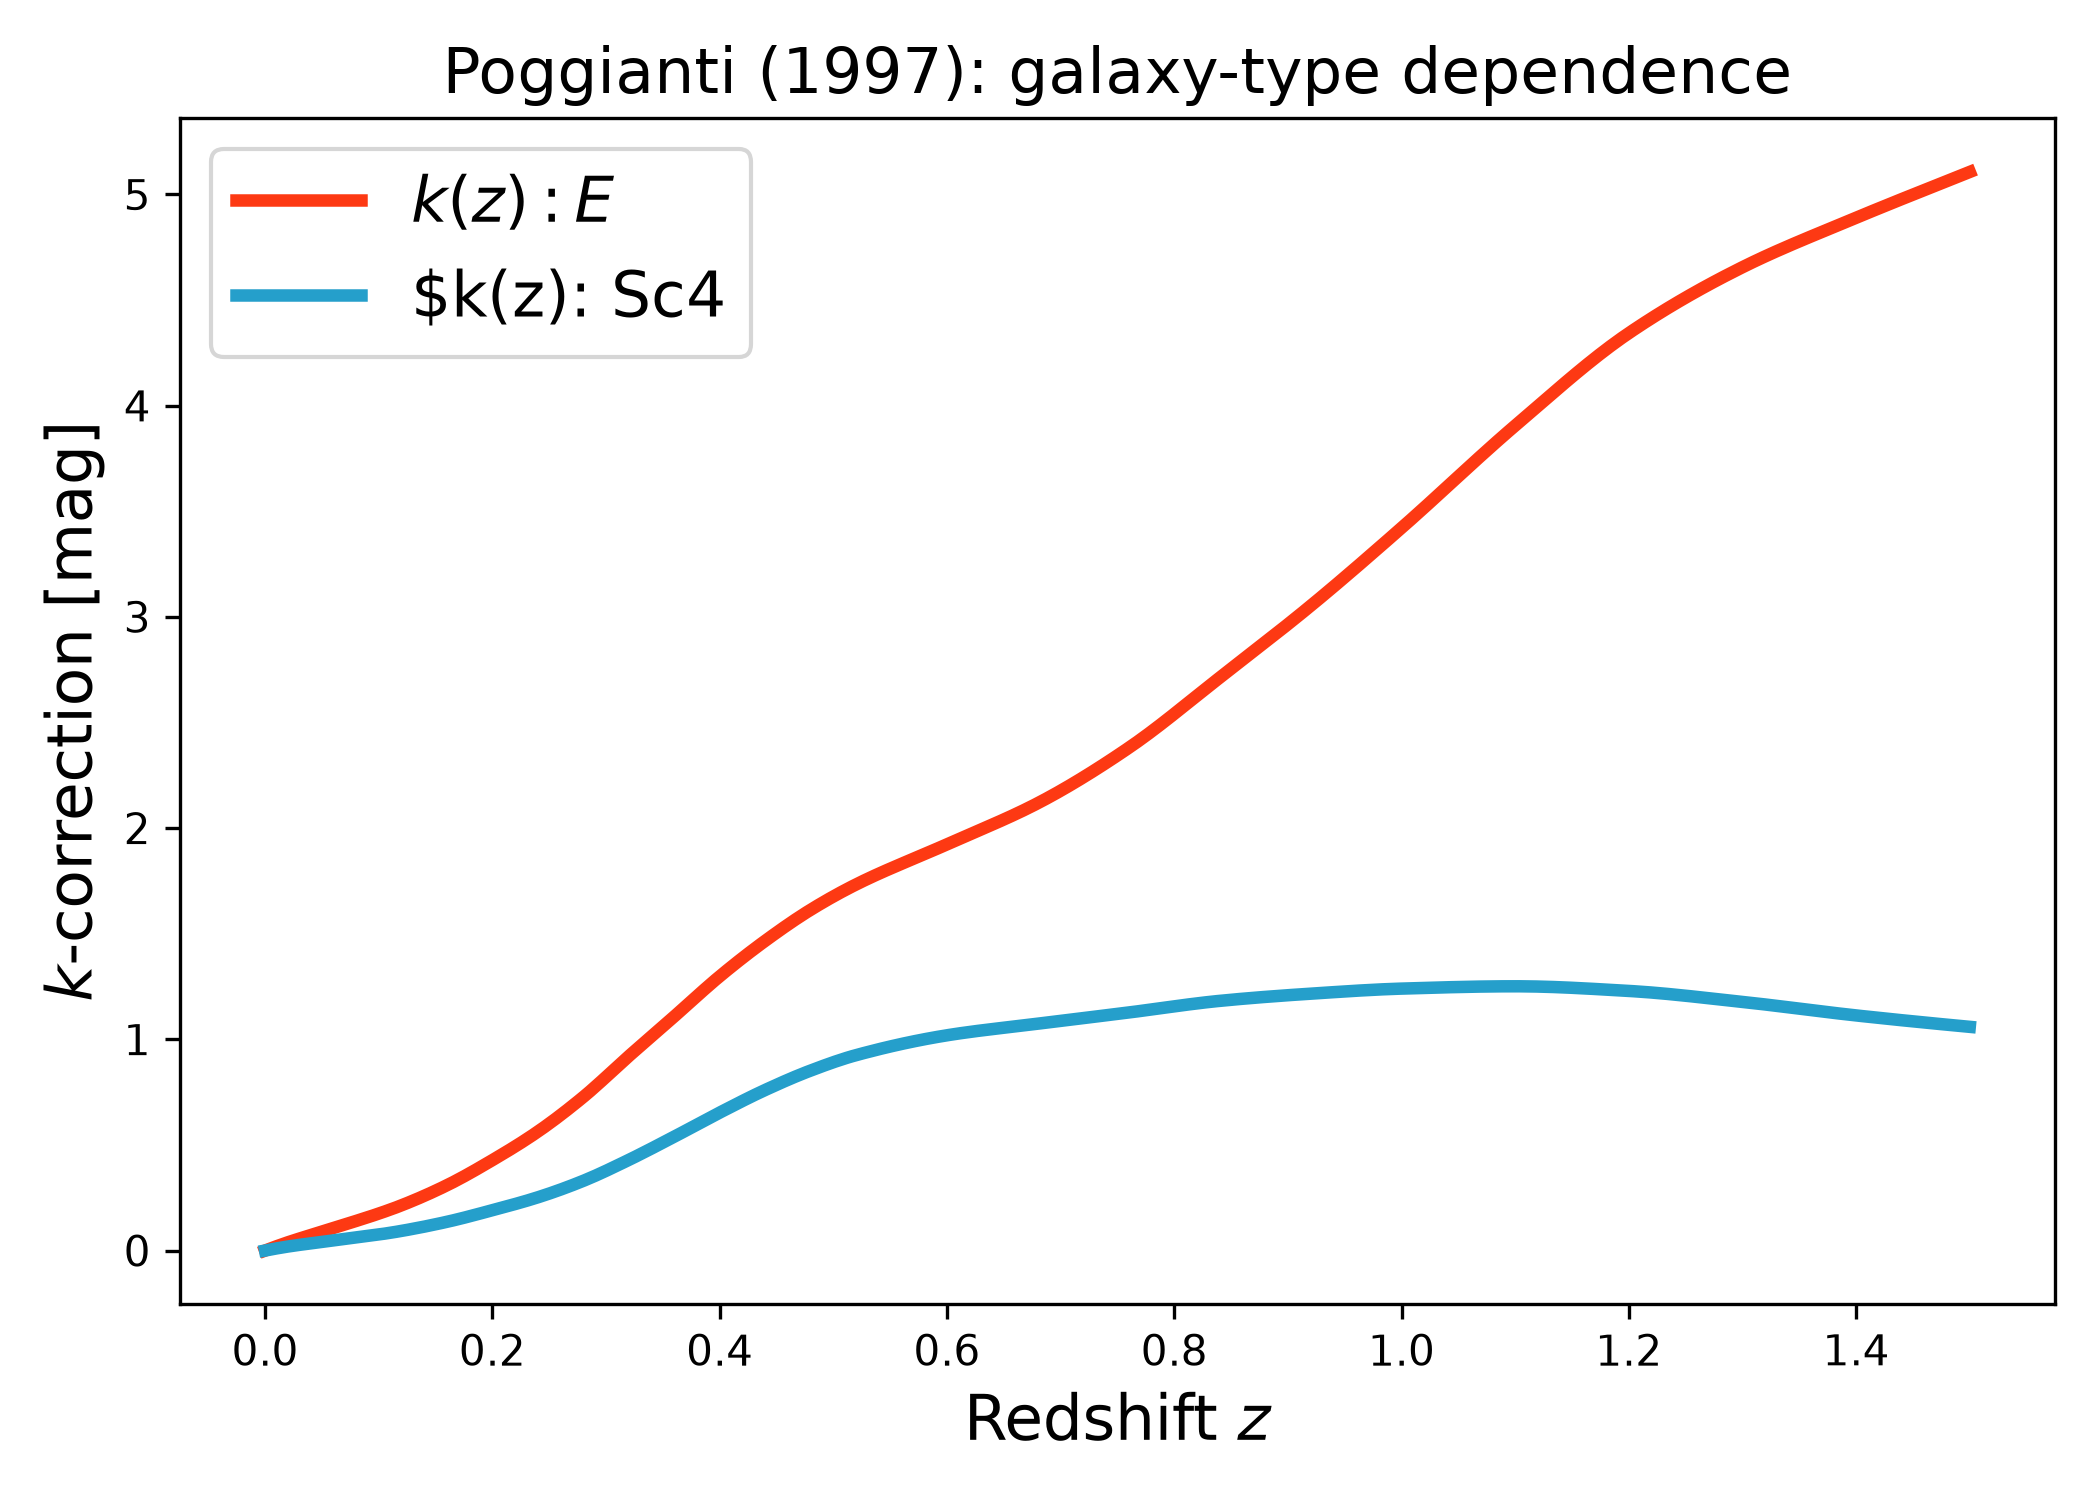
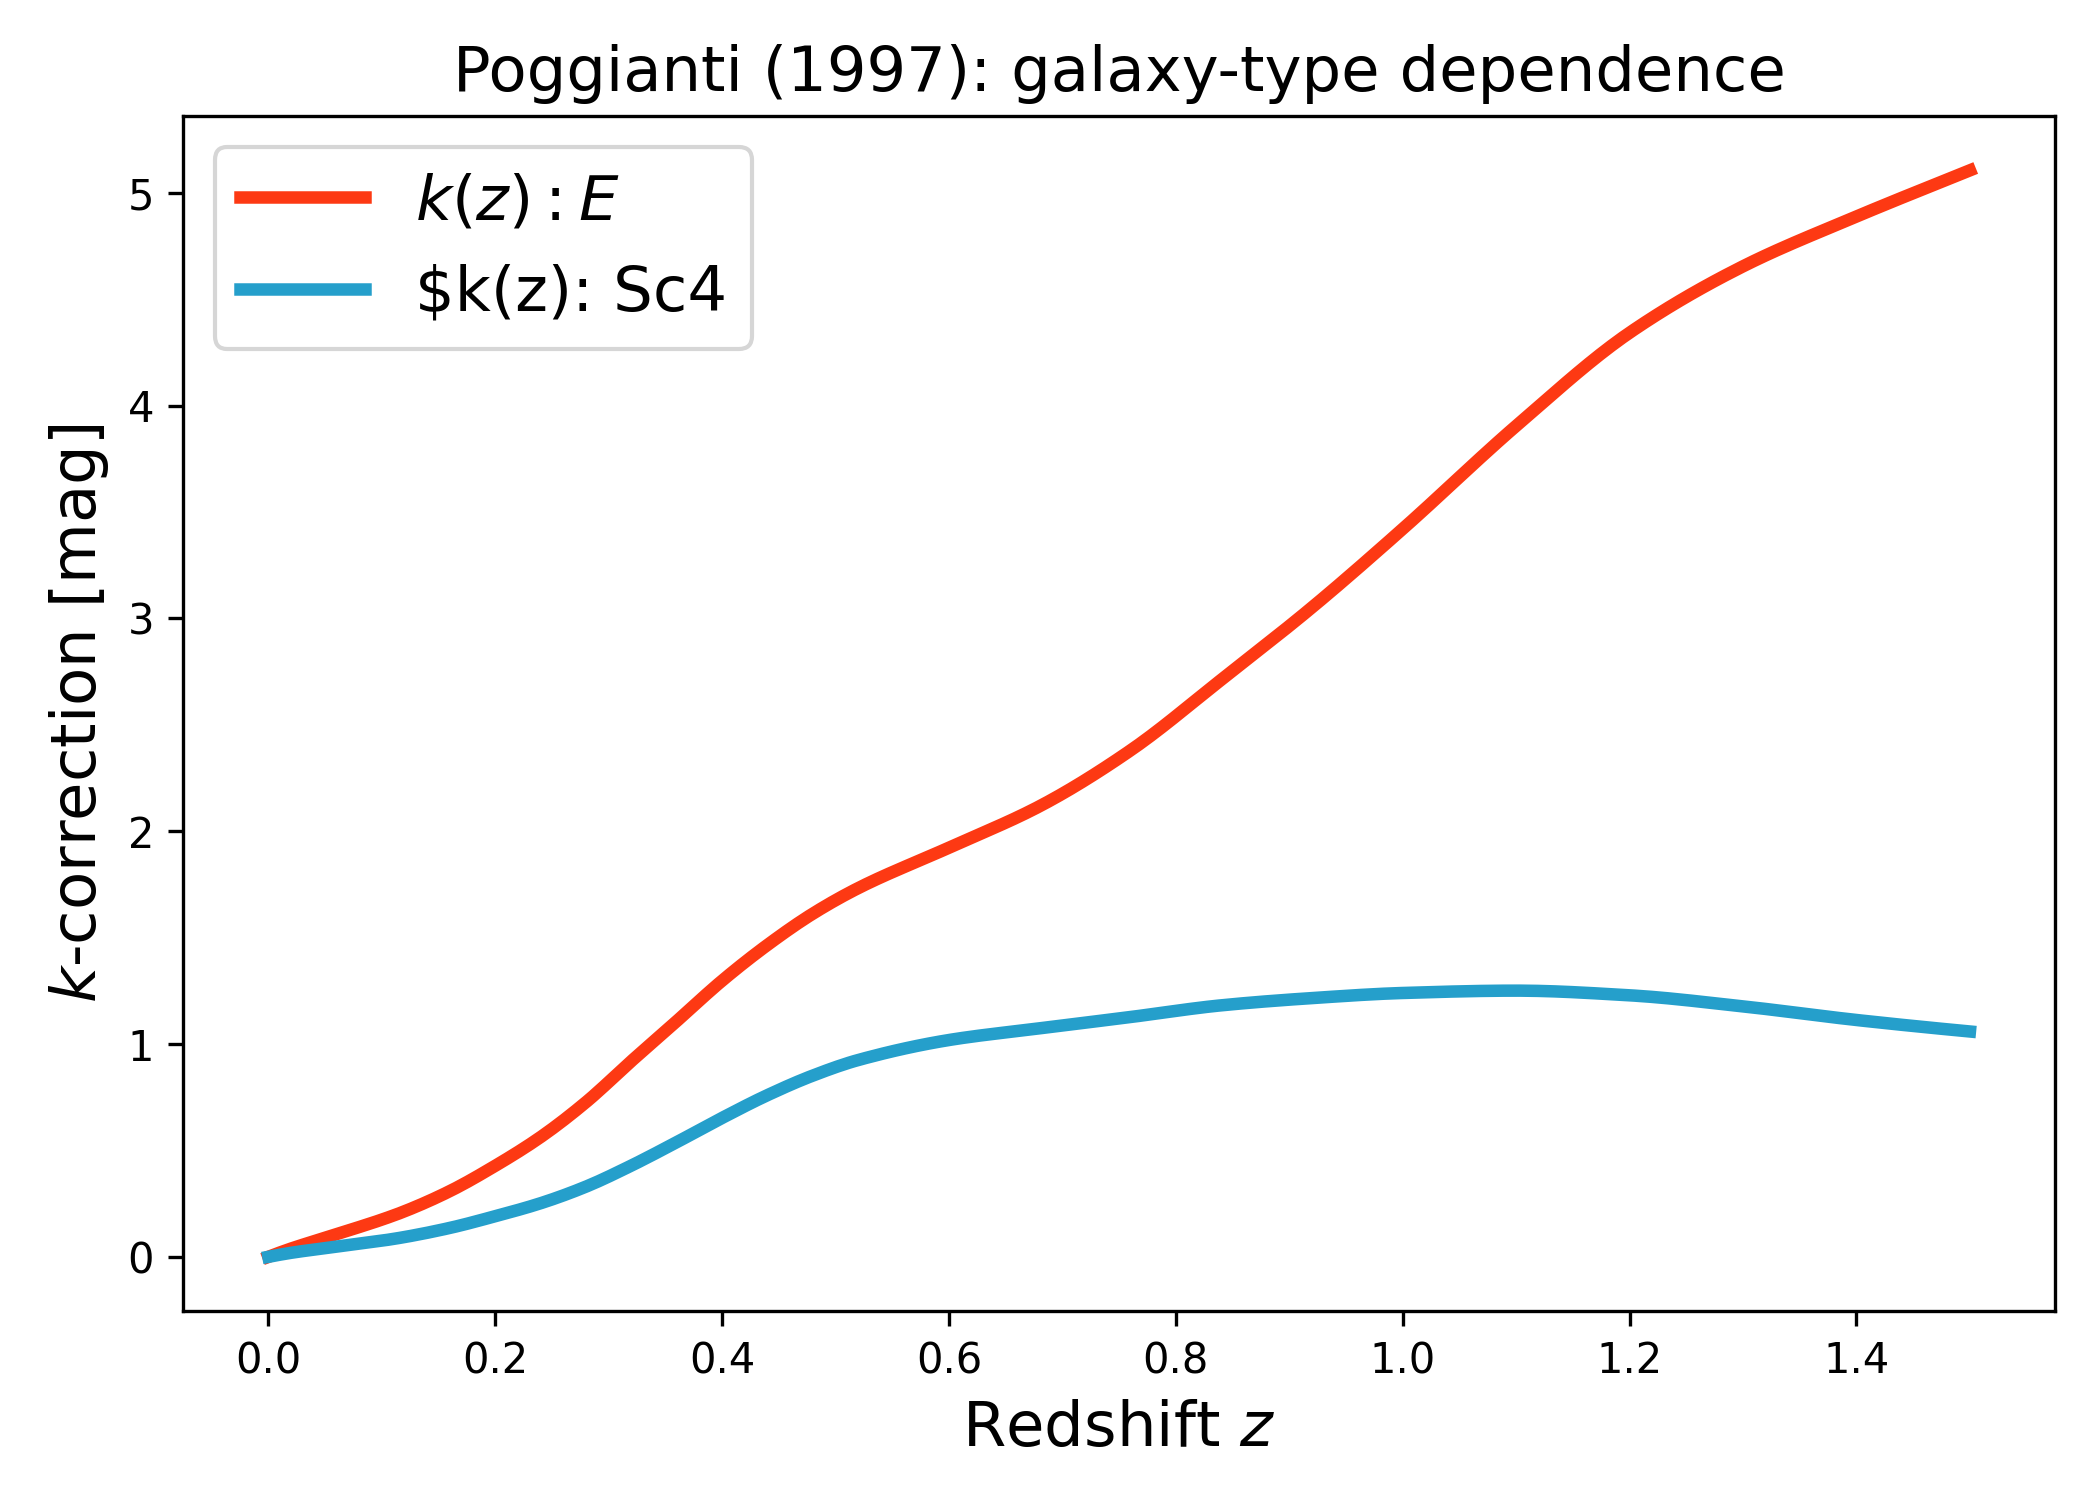
Galaxy type dependence: E vs Sc#
Compare two Poggianti galaxy types at fixed band.
import numpy as np
import matplotlib.pyplot as plt
import cmasher as cmr

from lfkit import Corrections

z = np.linspace(0.0, 1.5, 300)

corr_E  = Corrections.poggianti(band="V", gal_type="E")
corr_Sc = Corrections.poggianti(band="V", gal_type="Sc")

cmap = "cmr.guppy"
c_red  = cmr.take_cmap_colors(cmap, 3, cmap_range=(0.0, 0.25))[1]
c_blue = cmr.take_cmap_colors(cmap, 3, cmap_range=(0.75, 1.0))[1]

plt.figure(figsize=(7.0, 5.0))
lw = 3
fs = 15

plt.plot(z, corr_E.k(z),  lw=lw, color=c_red,  label=r"$k(z): E$")
plt.plot(z, corr_Sc.k(z), lw=lw, color=c_blue, label=r"$k(z): Sc4")

plt.xlabel("Redshift $z$", fontsize=fs)
plt.ylabel("$k$-correction [mag]", fontsize=fs)
plt.title("Poggianti (1997): galaxy-type dependence", fontsize=fs)
plt.legend(frameon=True, fontsize=fs)
plt.tight_layout()
(png)
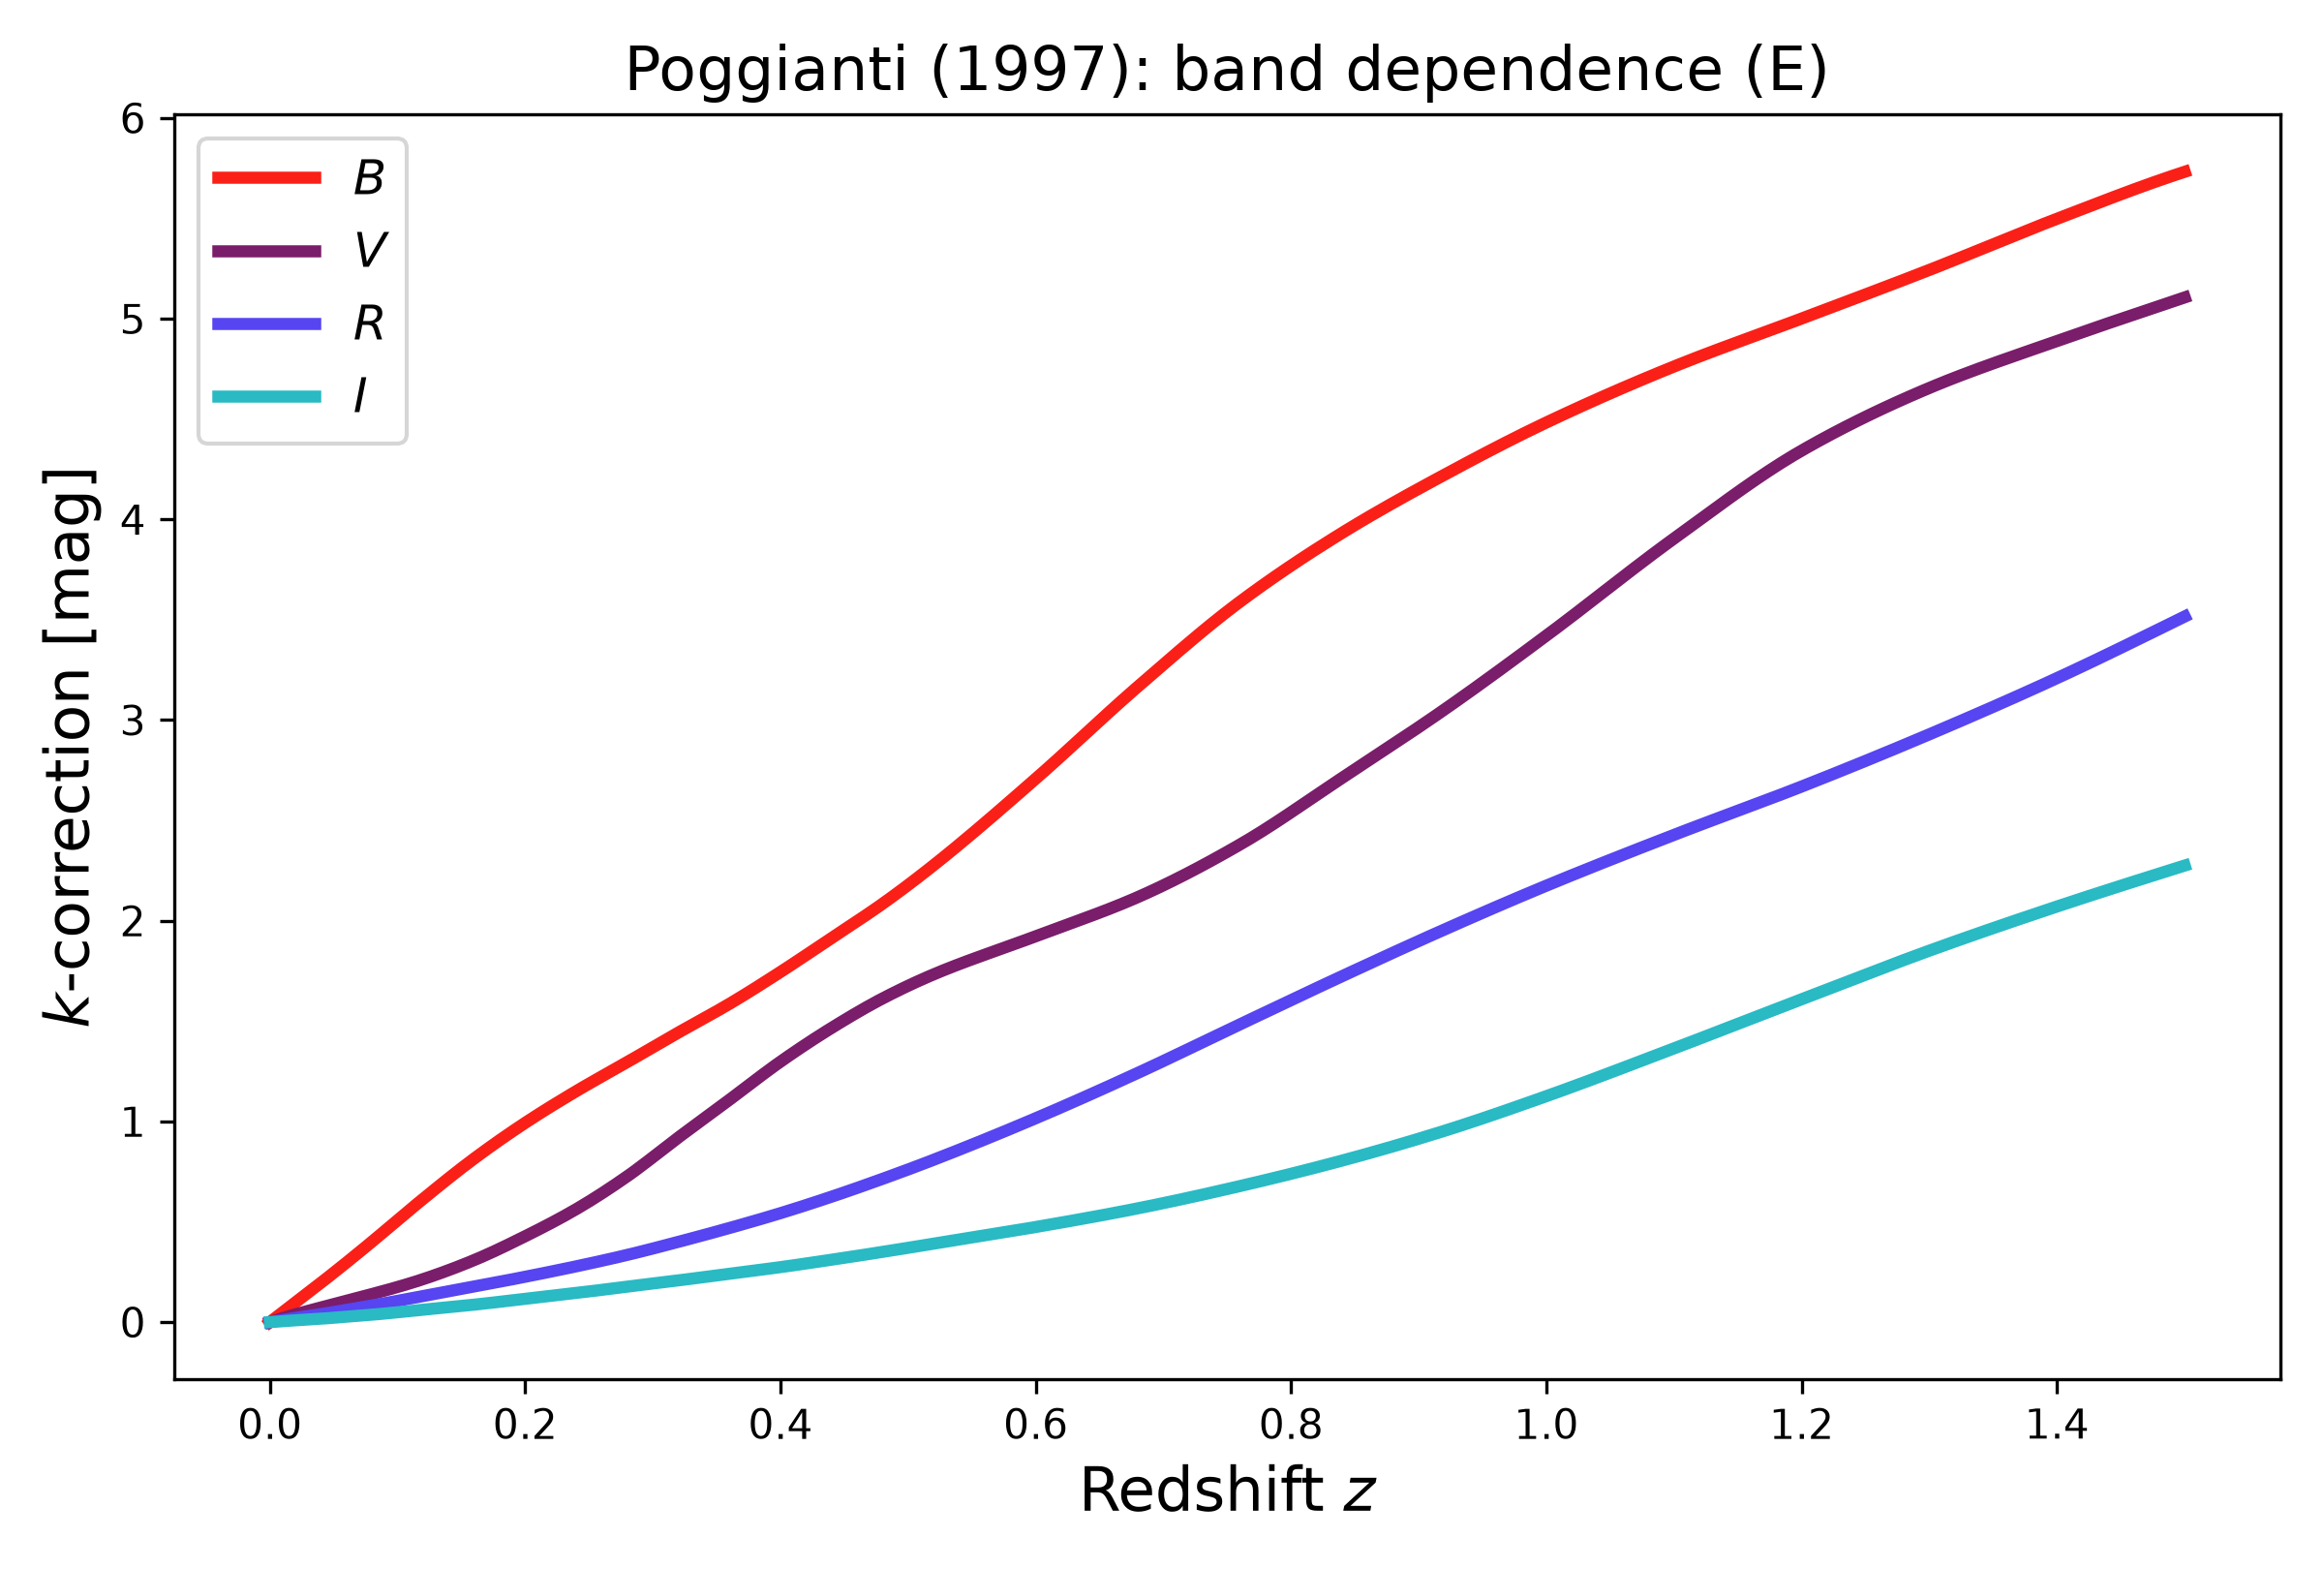
Band dependence: B, V, R, I#
Compare multiple Poggianti bands for a fixed galaxy type.
import numpy as np
import matplotlib.pyplot as plt
import cmasher as cmr

from lfkit import Corrections

z = np.linspace(0.0, 1.5, 300)
bands = ["B", "V", "R", "I"]

cmap = "cmr.guppy"
cols = cmr.take_cmap_colors(cmap, len(bands), cmap_range=(0.15, 0.95))

plt.figure(figsize=(8.0, 5.4))
lw = 3
fs = 15

for band, c in zip(bands, cols):
    corr = Corrections.poggianti(band=band, gal_type="E")
    plt.plot(z, corr.k(z), lw=lw, color=c, label=f"${band}$")

plt.xlabel("Redshift $z$", fontsize=fs)
plt.ylabel("$k$-correction [mag]", fontsize=fs)
plt.title("Poggianti (1997): band dependence (E)", fontsize=fs)
plt.legend(frameon=True, fontsize=12, loc="upper left")
plt.tight_layout()
(png)
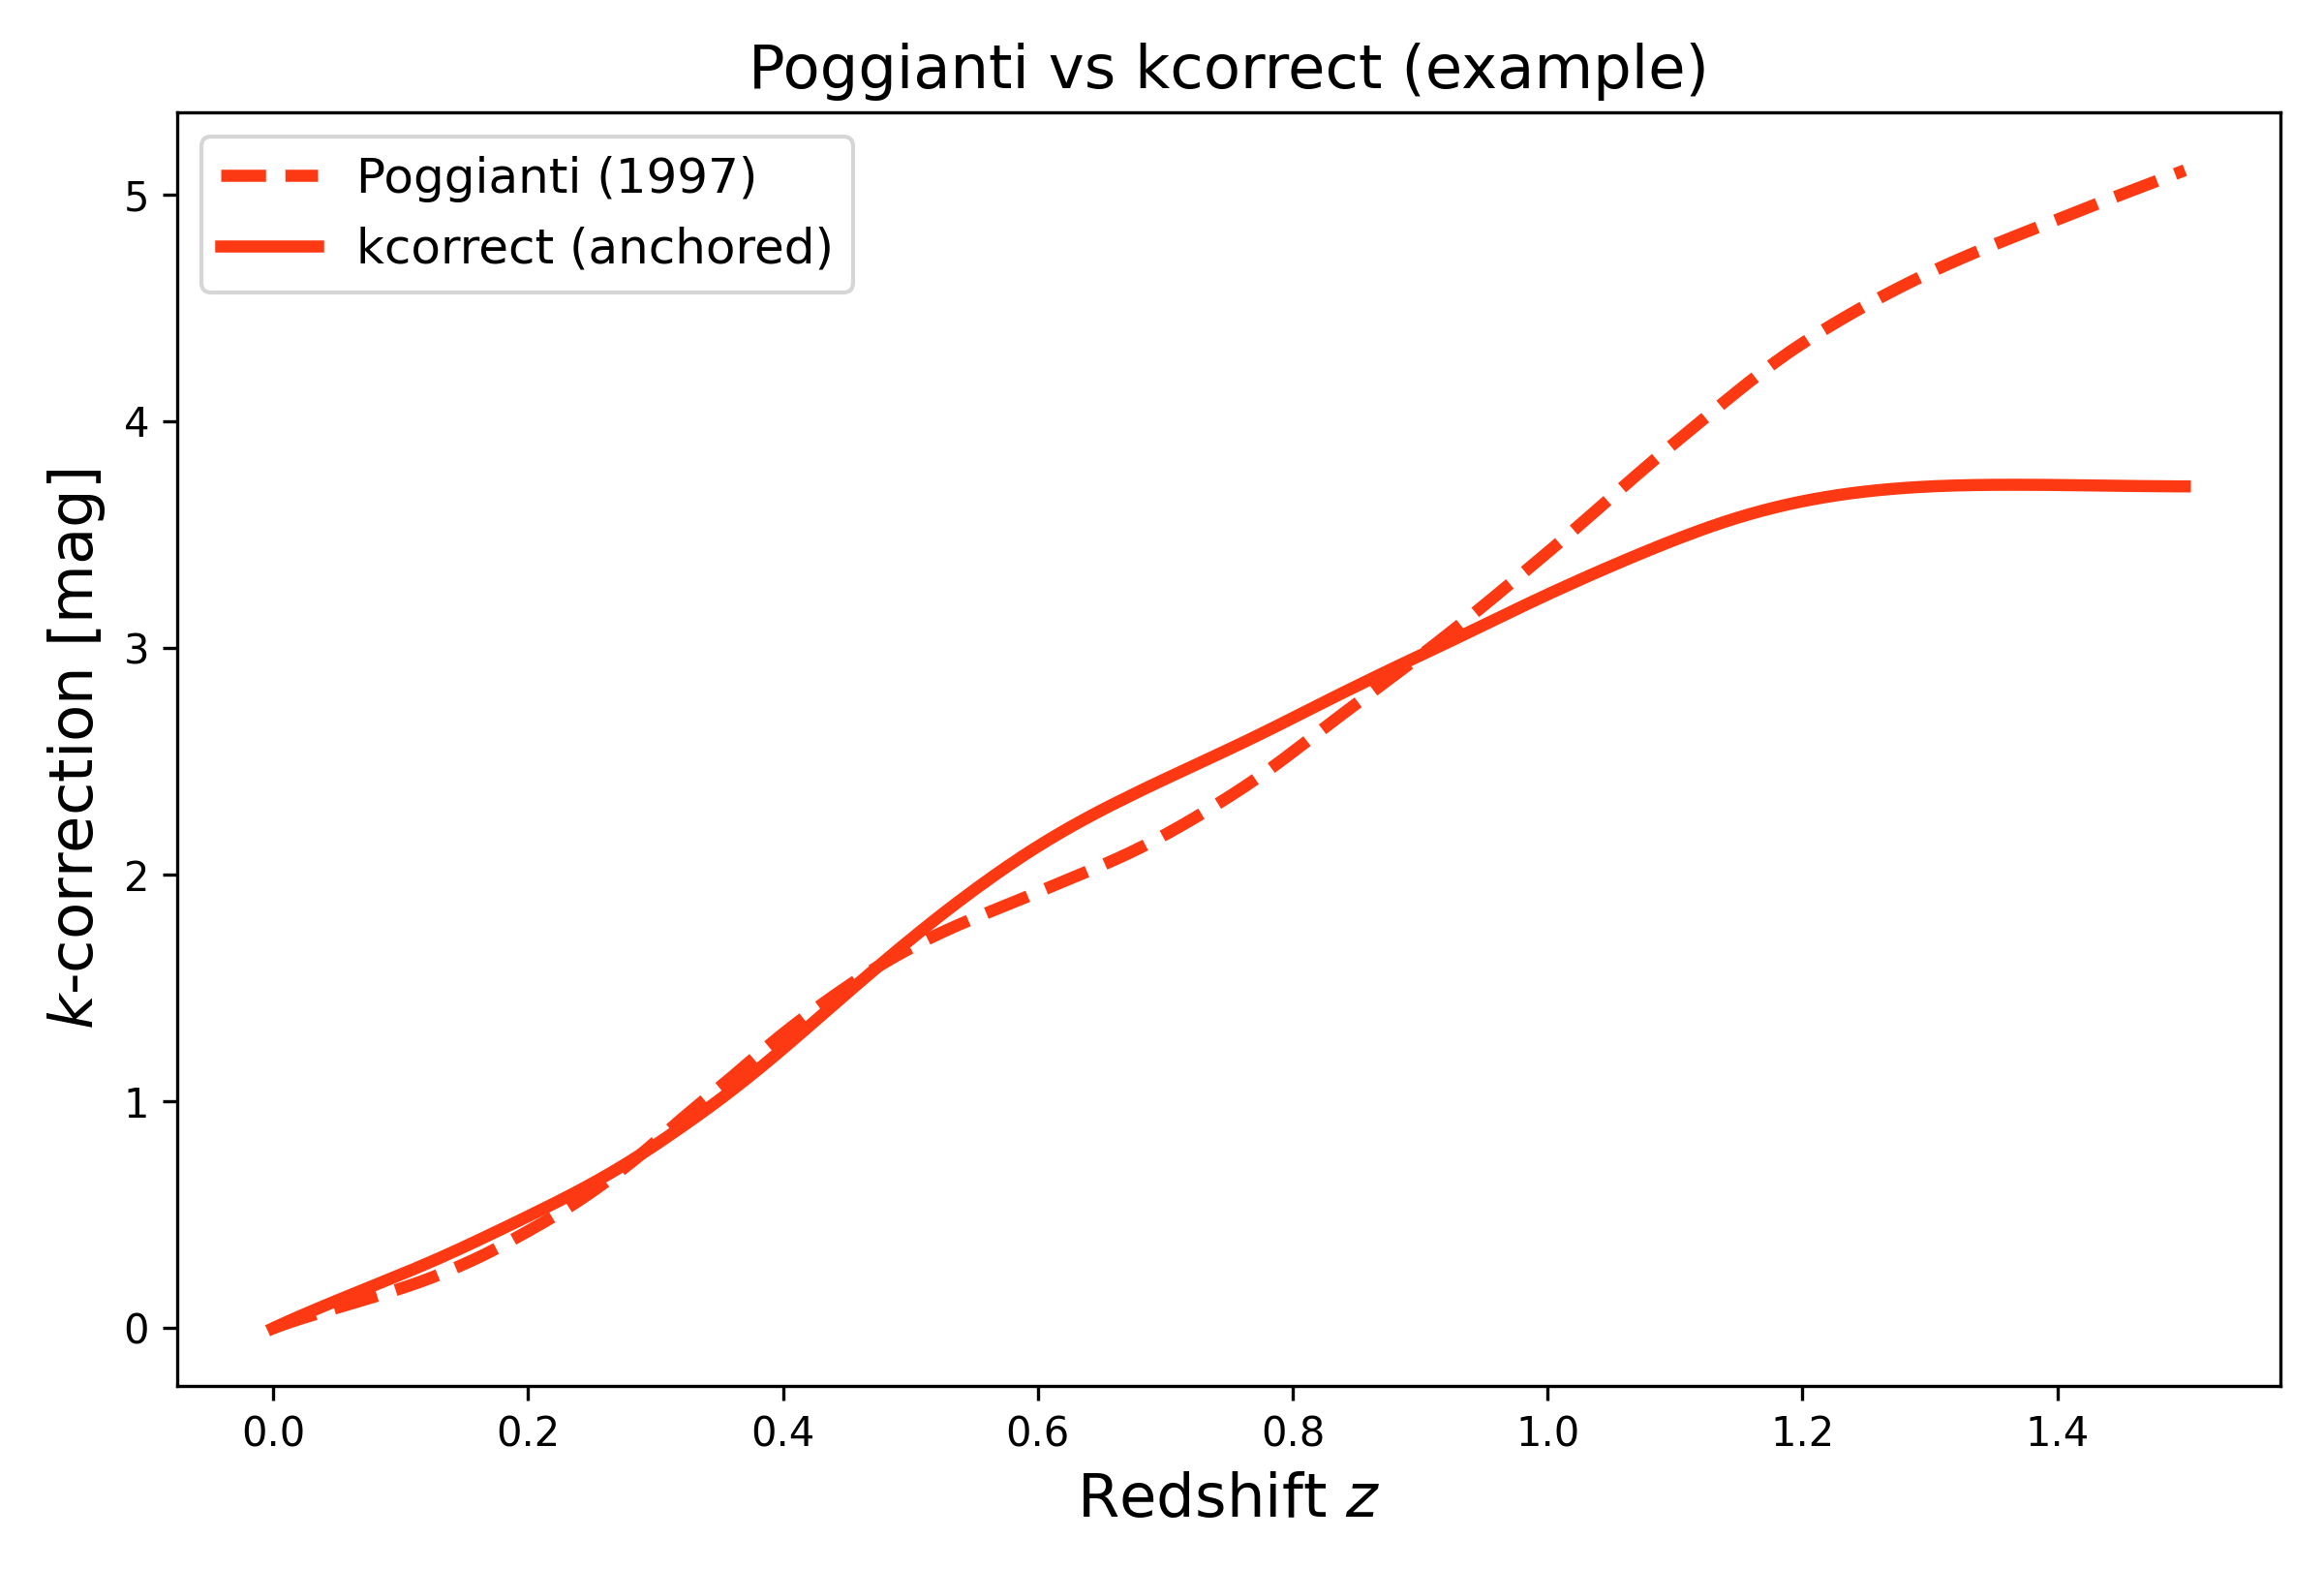
Compare Poggianti vs kcorrect in a shared band#
This example compares Poggianti (1997) \(k(z)\) to kcorrect-based \(k(z)\) for the same nominal output band.
import numpy as np
import matplotlib.pyplot as plt
import cmasher as cmr

from lfkit import Corrections

z = np.linspace(0.0, 1.5, 300)

# Poggianti curve
pog = Corrections.poggianti(
    band="V",
    gal_type="E",
    method="pchip",
    extrapolate=True,
)
k_pog = pog.k(z)

# kcorrect curve (anchored by a rest-frame color)
kc = Corrections.kcorrect(
    response_out="bessell_V",
    color=("bessell_B", "bessell_V"),
    color_value=0.9,
    anchor_z0=True,
)
k_kc = kc.k(z)

cmap = "cmr.guppy"
c_red  = cmr.take_cmap_colors(cmap, 3, cmap_range=(0.0, 0.25))[1]

plt.figure(figsize=(8.0, 5.4))
lw = 3
fs = 15

plt.plot(z, k_pog, lw=lw, ls="--", color=c_red,  label="Poggianti (1997)")
plt.plot(z, k_kc,  lw=lw, ls="-",  color=c_red, label="kcorrect (anchored)")

plt.xlabel("Redshift $z$", fontsize=fs)
plt.ylabel("$k$-correction [mag]", fontsize=fs)
plt.title("Poggianti vs kcorrect (example)", fontsize=fs)
plt.legend(frameon=True, fontsize=12, loc="upper left")
plt.tight_layout()
(png)
Loading the raw Poggianti tables (advanced)#
If you need the underlying tabulated data (e.g. for validation), you can load it directly from the Poggianti backend.
import lfkit.corrections.poggianti1997 as pogg

z_k, kcorr, z_e, ecorr = pogg.load_poggianti1997_tables(band="V", sed="E")

print("K table:", z_k[:5], kcorr[:5])
print("E table:", z_e[:5], ecorr[:5)