 Gaussian-like models#
Gaussian-like models describe localized luminosity populations with a peak and a width. They are useful for toy models, narrow galaxy populations, or as components in composite luminosity functions.
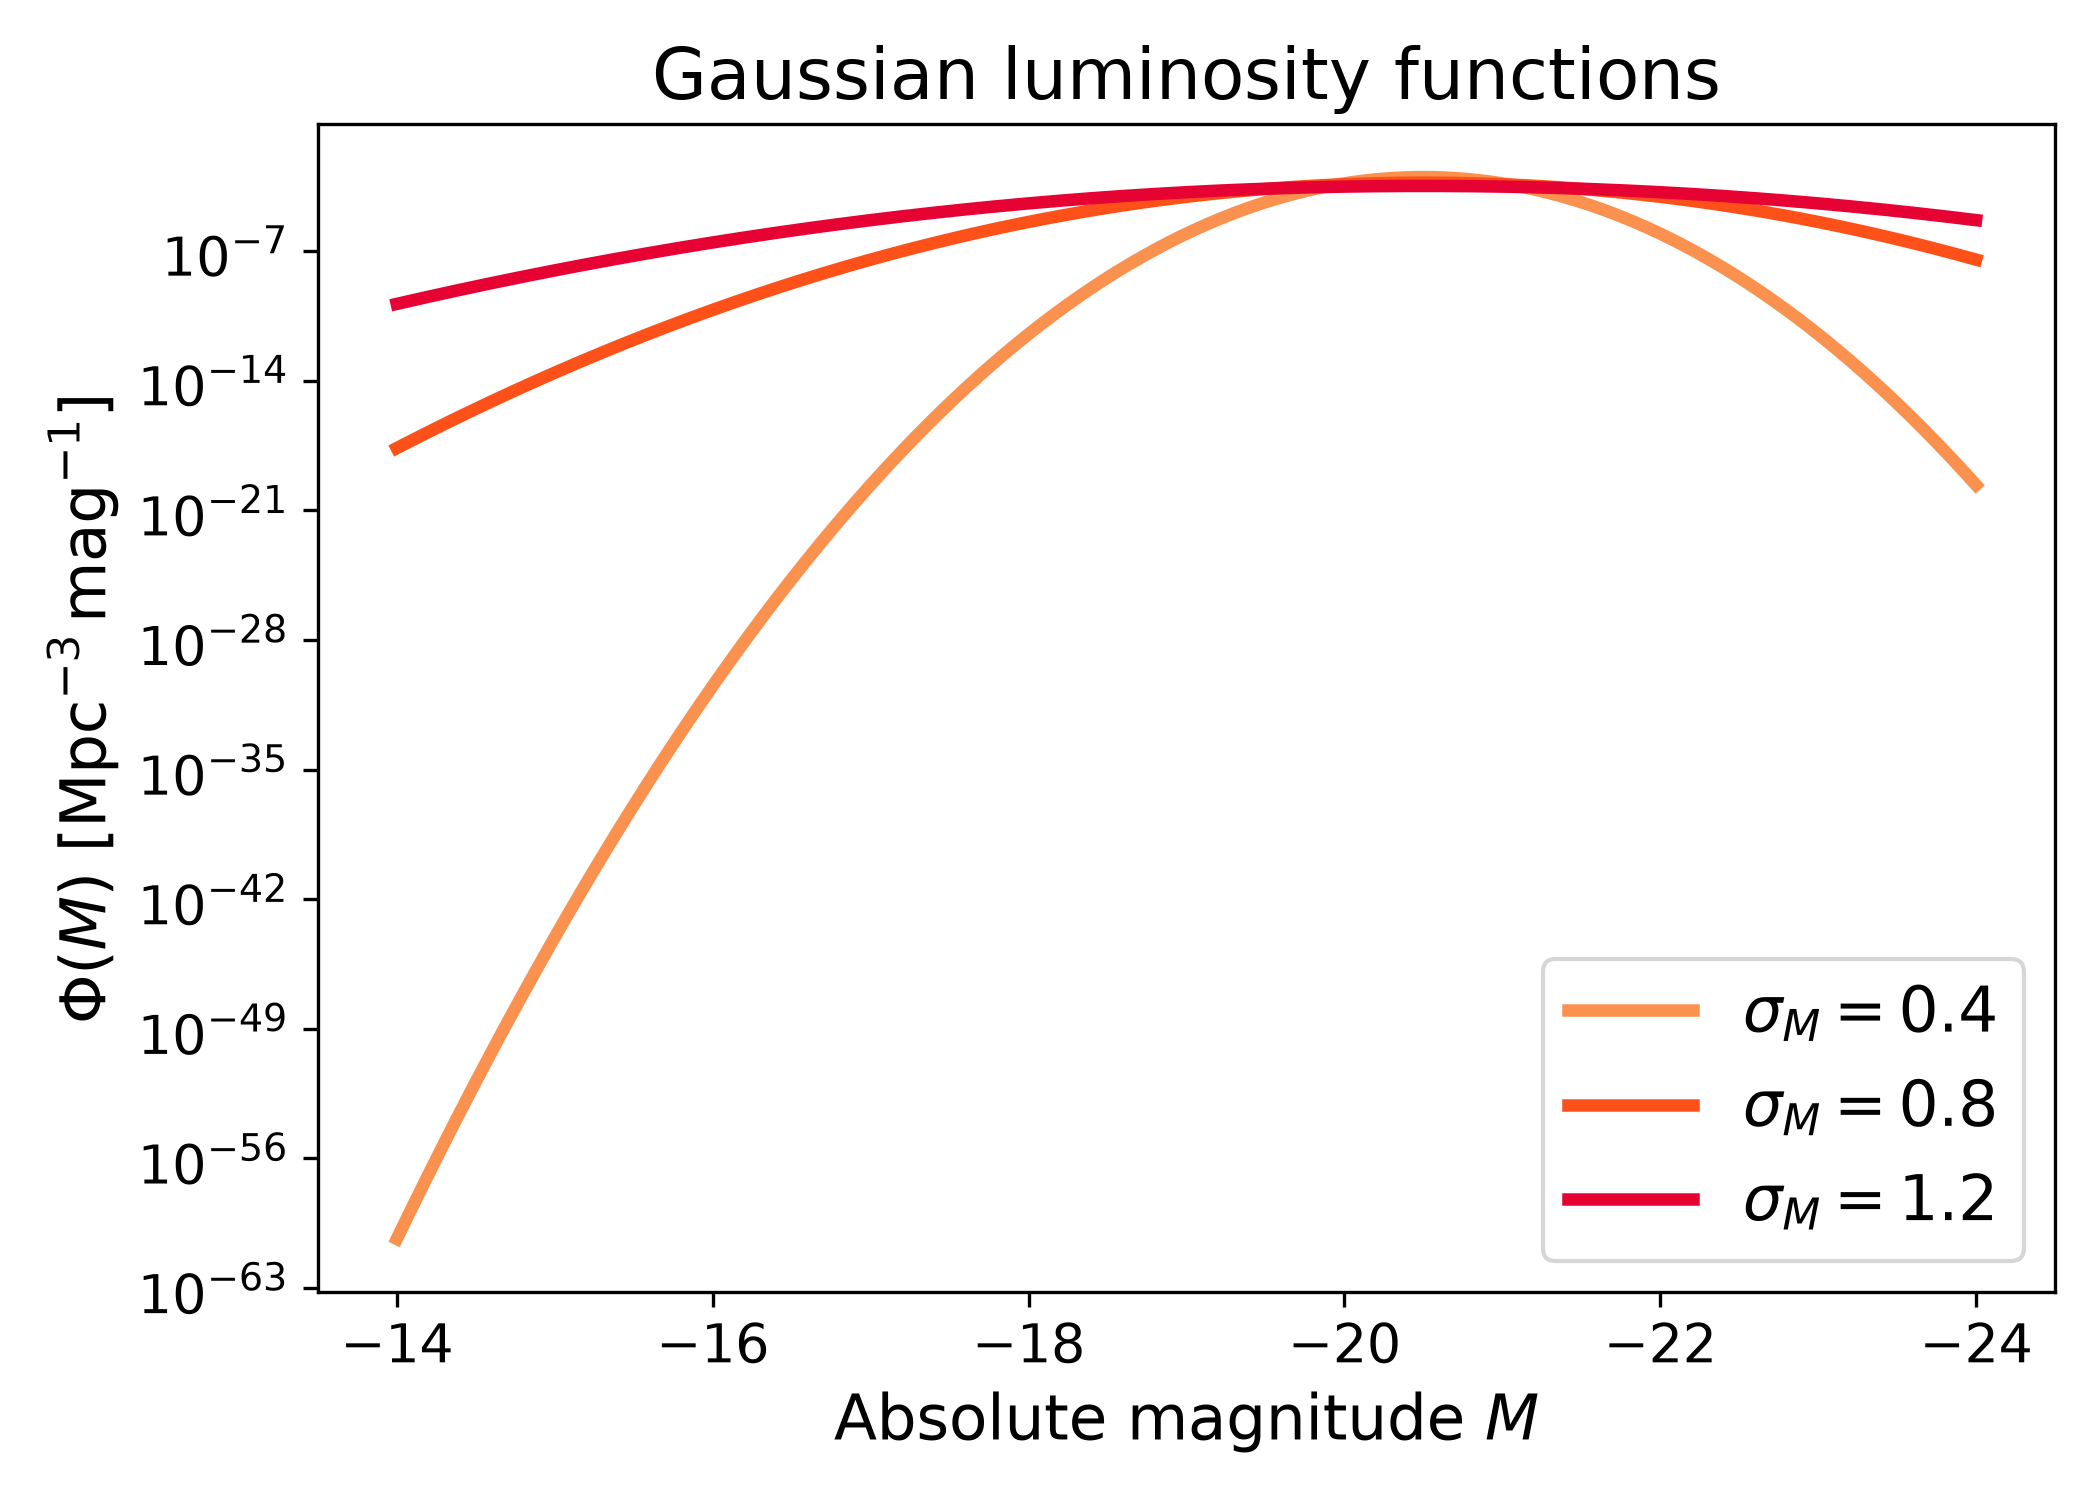
Gaussian luminosity function#
The Gaussian model is defined directly in magnitude space. The parameter
mean_absolute_mag controls the peak location, sigma_absolute_mag
controls the width, and amplitude controls the total normalization.
import numpy as np
import matplotlib.pyplot as plt
import cmasher as cmr

from lfkit import LuminosityFunction

LABEL_SIZE = 15
TICK_SIZE = 13
TITLE_SIZE = 17
LEGEND_SIZE = 15

absolute_mag = np.linspace(-24.0, -14.0, 500)
sigmas = [0.4, 0.8, 1.2]
colors = cmr.take_cmap_colors("cmr.guppy", len(sigmas), cmap_range=(0.0, 0.2))

fig, ax = plt.subplots(figsize=(7.0, 5.0))

for sigma, color in zip(sigmas, colors):
    lf = LuminosityFunction.gaussian(
        mean_absolute_mag=-20.5,
        sigma_absolute_mag=sigma,
        amplitude=1.0e-3,
    )
    ax.plot(
        absolute_mag,
        lf.phi(absolute_mag),
        lw=3,
        color=color,
        label=rf"$\sigma_M={sigma}$",
    )

ax.set_yscale("log")
ax.invert_xaxis()
ax.set_xlabel("Absolute magnitude $M$", fontsize=LABEL_SIZE)
ax.set_ylabel(
    r"$\Phi(M)$ [$\mathrm{Mpc}^{-3}\,\mathrm{mag}^{-1}$]",
    fontsize=LABEL_SIZE,
)
ax.set_title("Gaussian luminosity functions", fontsize=TITLE_SIZE)
ax.tick_params(axis="both", labelsize=TICK_SIZE)
ax.legend(frameon=True, fontsize=LEGEND_SIZE, loc="best")
plt.tight_layout()
(png)

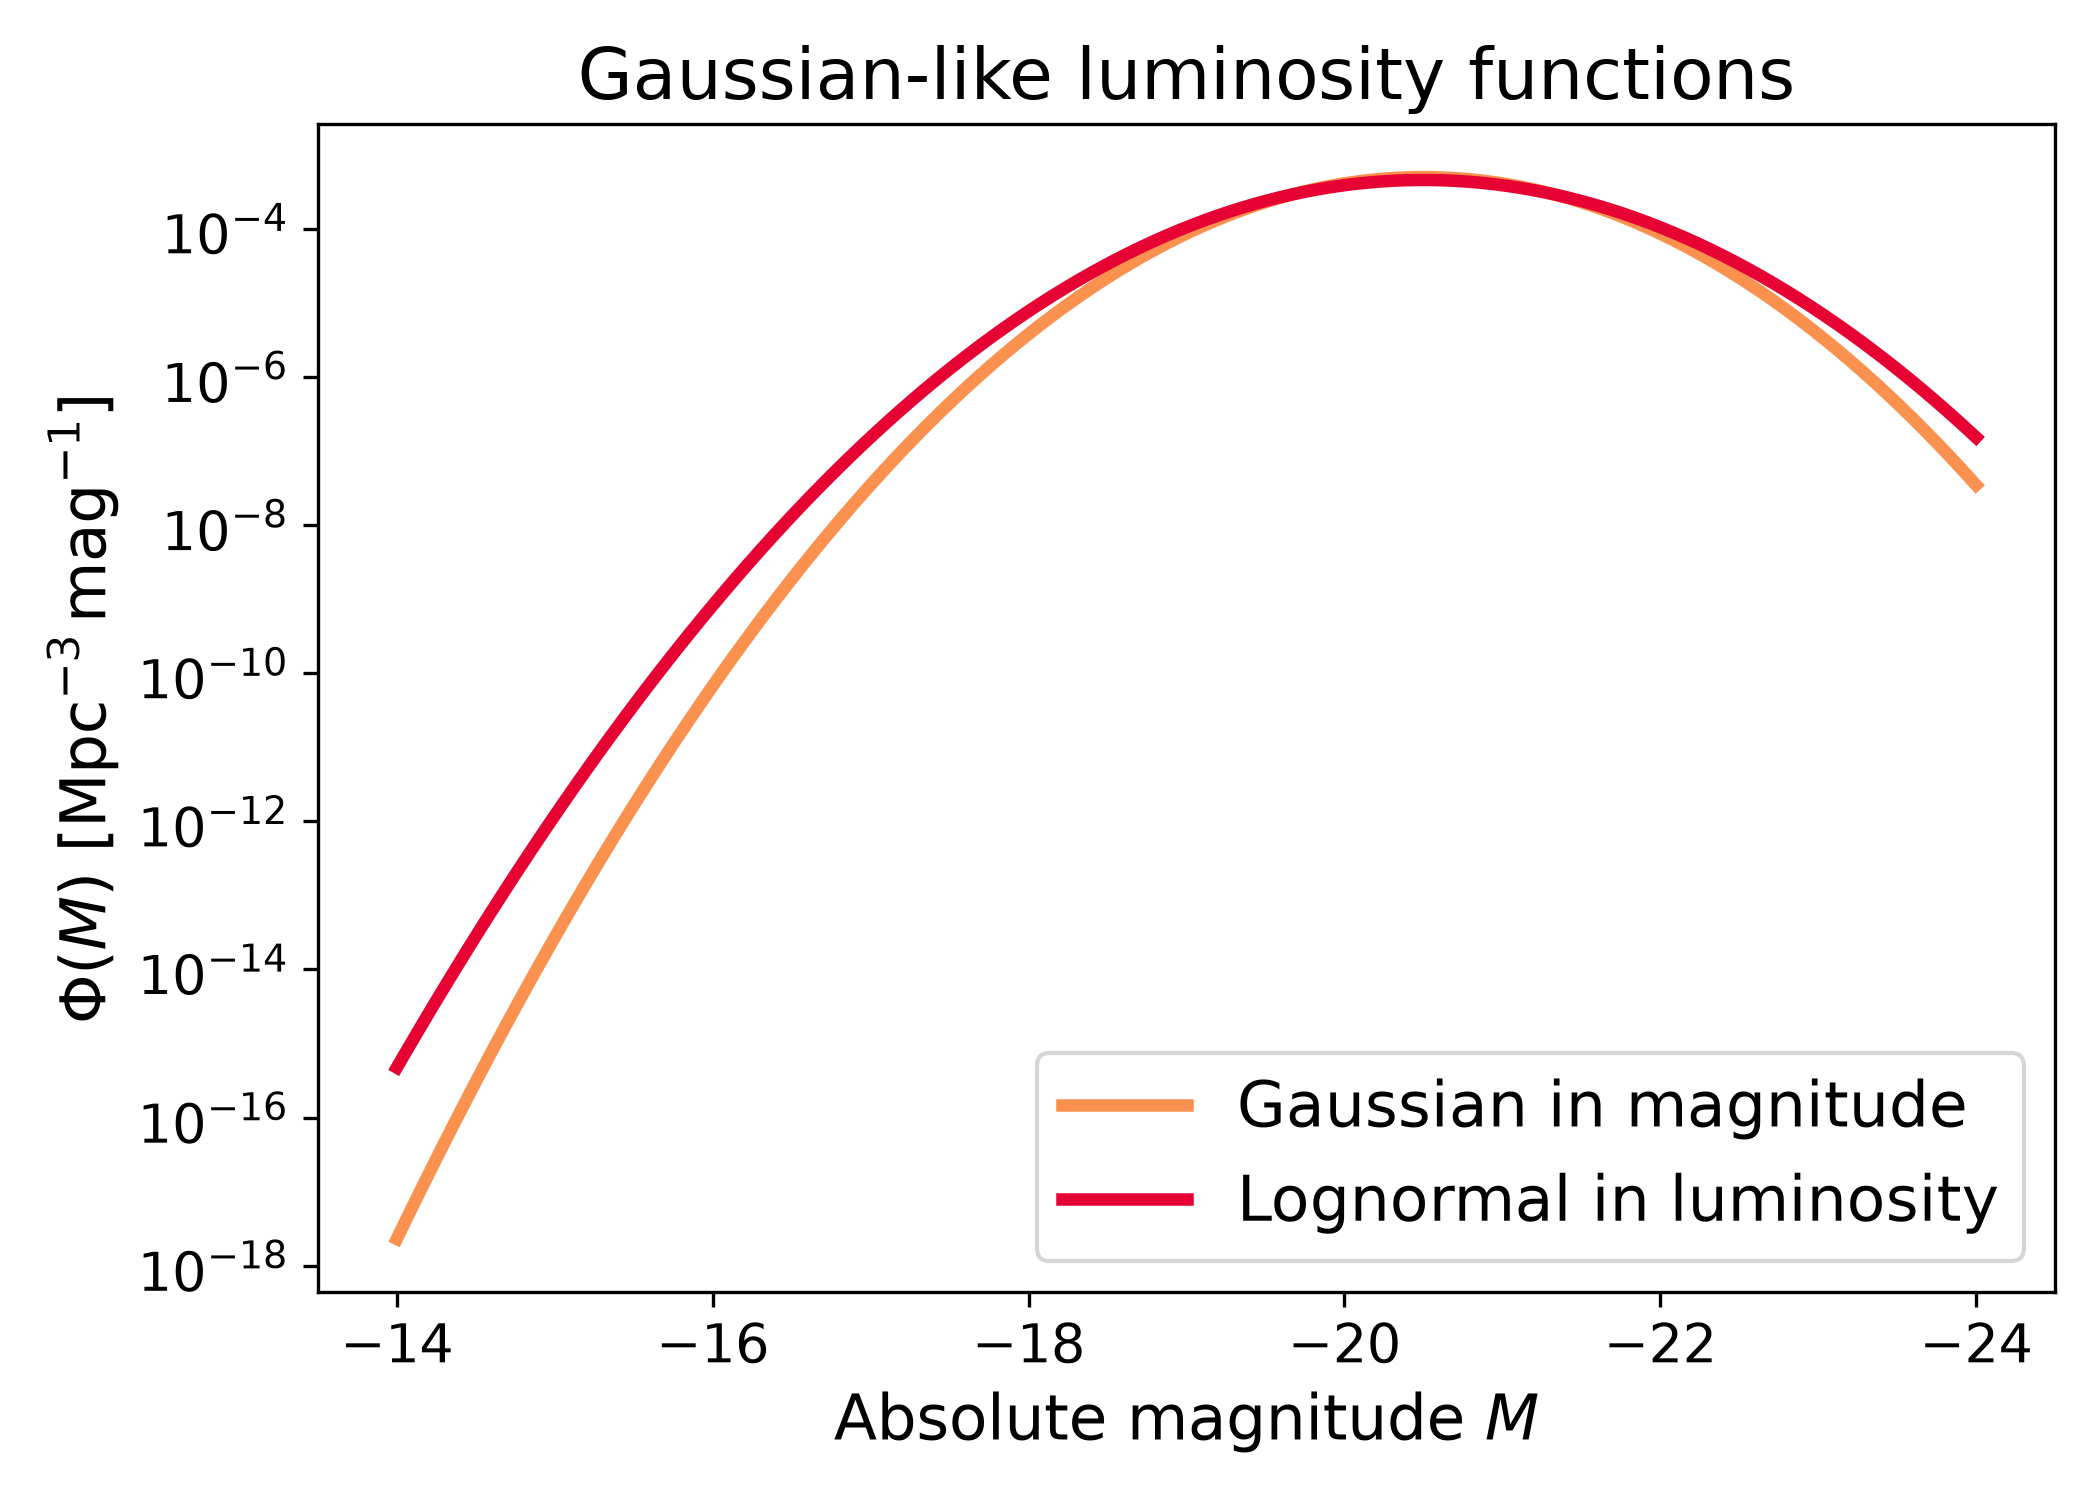
Lognormal luminosity function#
The lognormal model is Gaussian in logarithmic luminosity rather than directly Gaussian in magnitude. It is useful when the width of the population is more naturally described in \(\log L\).
import numpy as np
import matplotlib.pyplot as plt
import cmasher as cmr

from lfkit import LuminosityFunction

LABEL_SIZE = 15
TICK_SIZE = 13
TITLE_SIZE = 17
LEGEND_SIZE = 15

gaussian = LuminosityFunction.gaussian(
    mean_absolute_mag=-20.5,
    sigma_absolute_mag=0.8,
    amplitude=1.0e-3,
)

lognormal = LuminosityFunction.lognormal(
    mean_absolute_mag=-20.5,
    sigma_log_luminosity=0.35,
    amplitude=1.0e-3,
)

absolute_mag = np.linspace(-24.0, -14.0, 500)
colors = cmr.take_cmap_colors("cmr.guppy", 2, cmap_range=(0.0, 0.2))

fig, ax = plt.subplots(figsize=(7.0, 5.0))
ax.plot(
    absolute_mag,
    gaussian.phi(absolute_mag),
    lw=3,
    color=colors[0],
    label="Gaussian in magnitude",
)
ax.plot(
    absolute_mag,
    lognormal.phi(absolute_mag),
    lw=3,
    color=colors[1],
    label="Lognormal in luminosity",
)

ax.set_yscale("log")
ax.invert_xaxis()
ax.set_xlabel("Absolute magnitude $M$", fontsize=LABEL_SIZE)
ax.set_ylabel(
    r"$\Phi(M)$ [$\mathrm{Mpc}^{-3}\,\mathrm{mag}^{-1}$]",
    fontsize=LABEL_SIZE,
)
ax.set_title("Gaussian-like luminosity functions", fontsize=TITLE_SIZE)
ax.tick_params(axis="both", labelsize=TICK_SIZE)
ax.legend(frameon=True, fontsize=LEGEND_SIZE, loc="best")
plt.tight_layout()
(png)
