 Schechter family models#
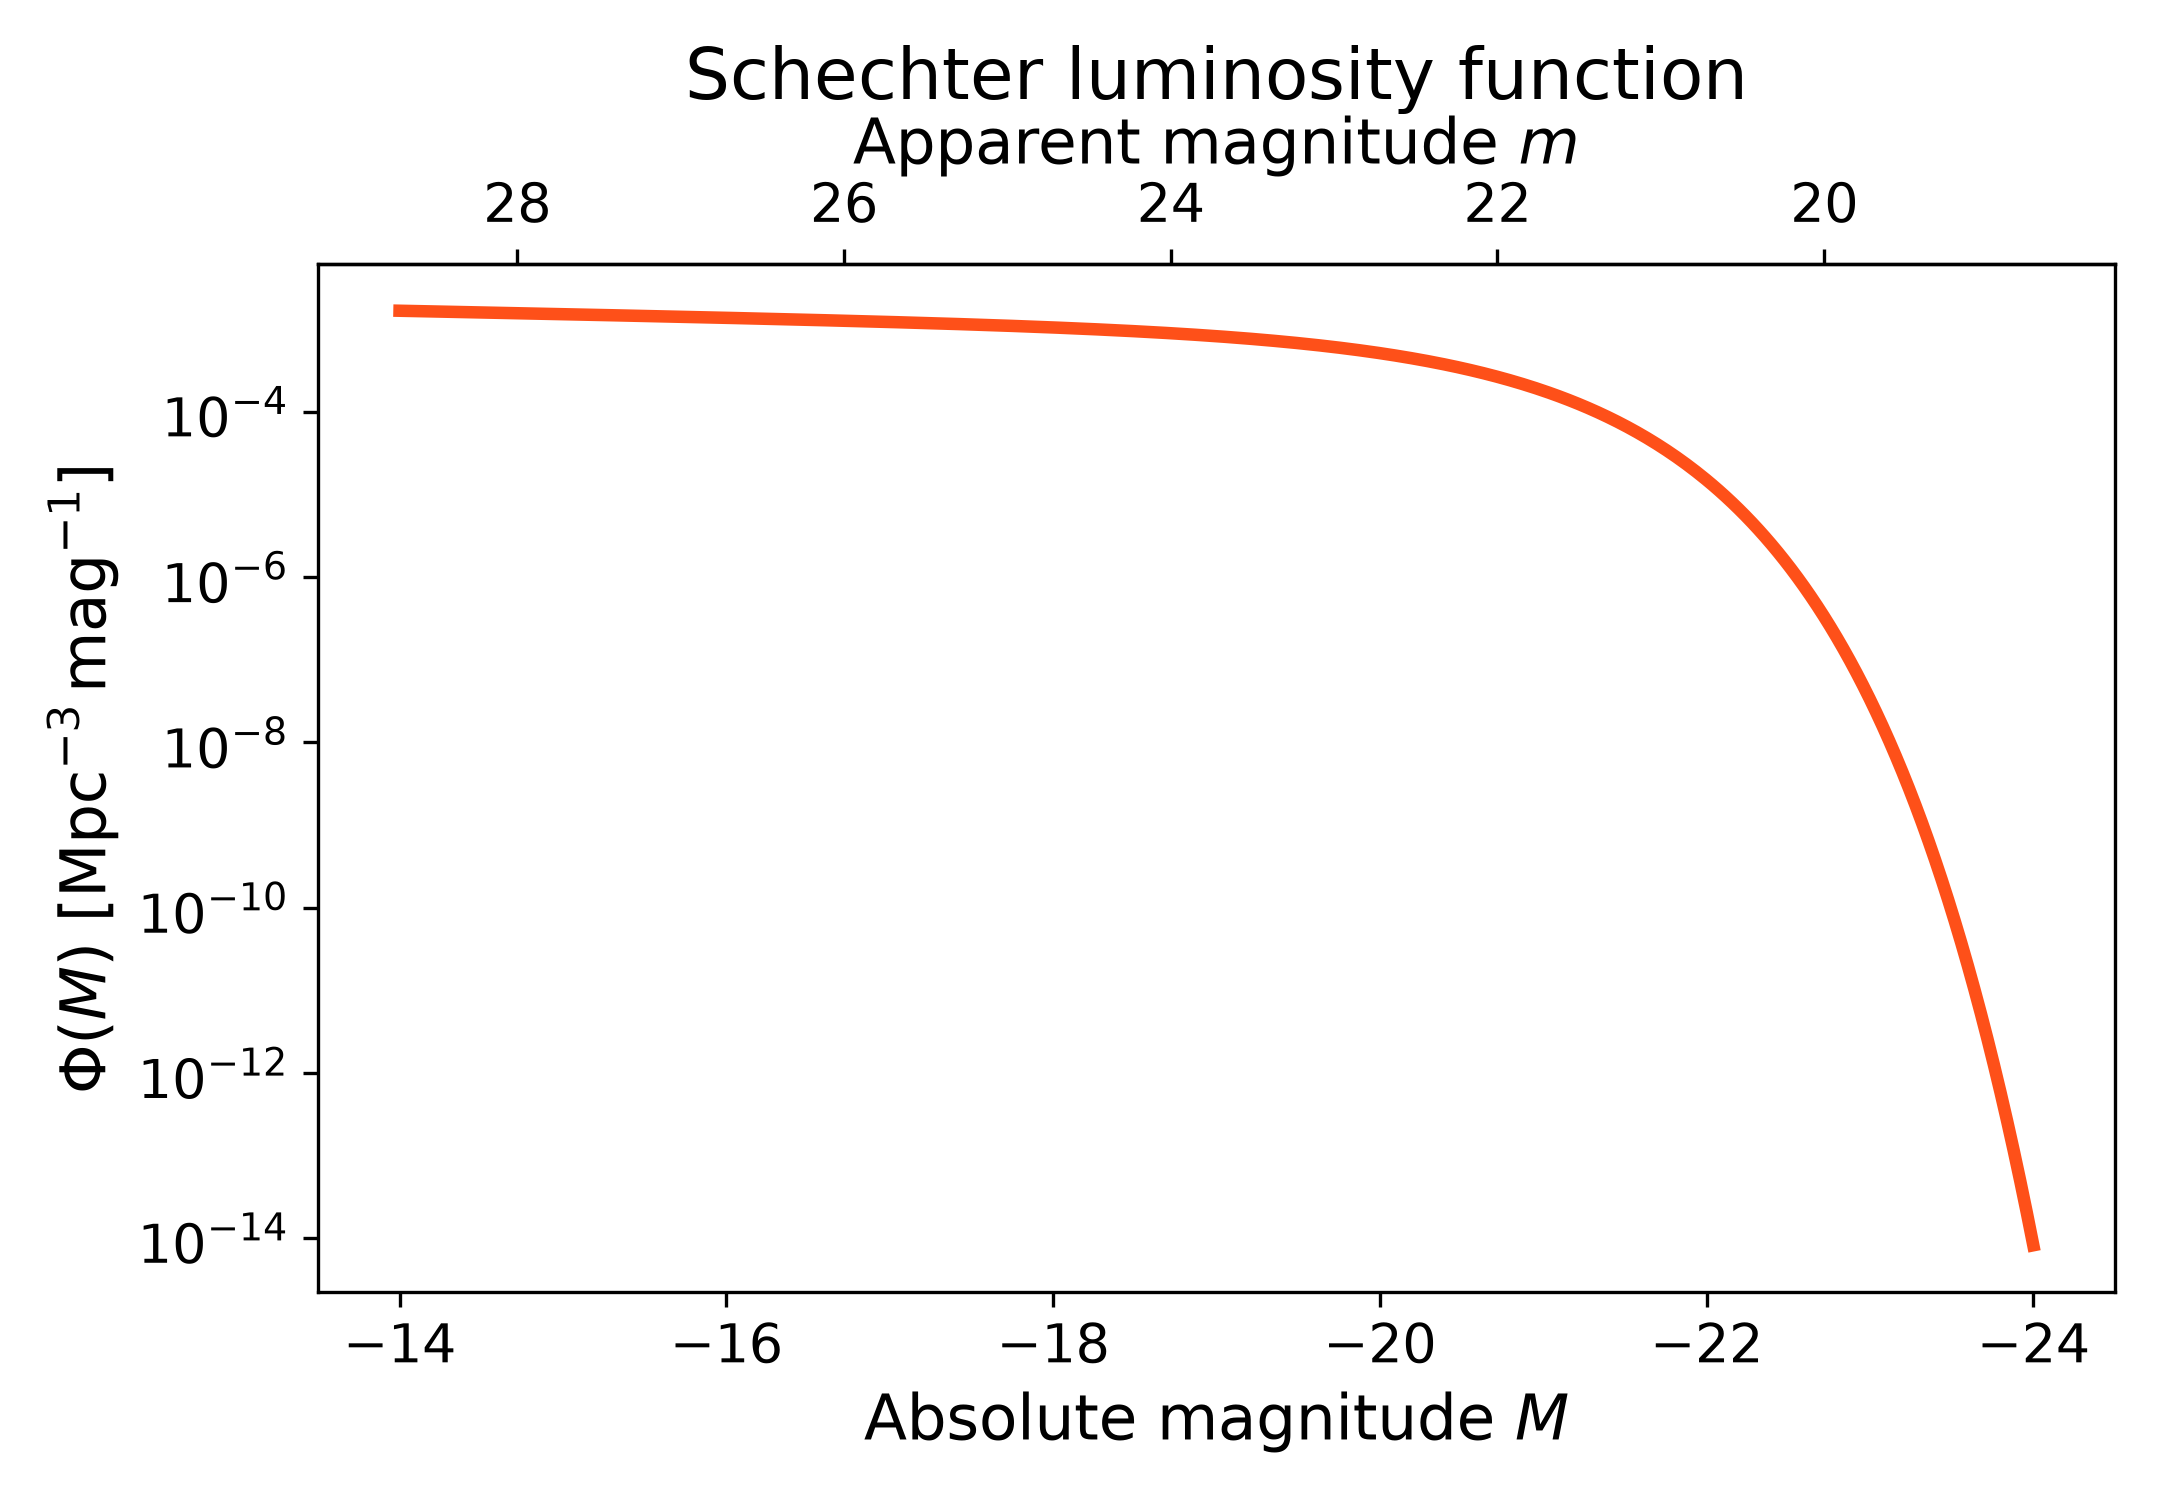
The Schechter family contains luminosity functions with a power law faint end and a bright-end cutoff. These models are commonly used when the abundance of faint galaxies rises approximately as a power law, while the most luminous galaxies are exponentially rare.
Standard Schechter luminosity function#
A Schechter luminosity function can be created with
lfkit.LuminosityFunction.schechter(). The returned object evaluates
\(\Phi(M)\) through lfkit.LuminosityFunction.phi().
The Schechter luminosity function is evaluated in absolute magnitude. A secondary x-axis can show the corresponding apparent magnitude at a fixed luminosity distance using the LFKit magnitude converters.
import numpy as np
import matplotlib.pyplot as plt
import cmasher as cmr

from lfkit import LuminosityFunction

LABEL_SIZE = 15
TICK_SIZE = 13
TITLE_SIZE = 17

lf = LuminosityFunction.schechter(
    phi_star=1.0e-3,
    m_star=-20.5,
    alpha=-1.1,
)

luminosity_distance_mpc = 3500.0
absolute_mag = np.linspace(-24.0, -14.0, 500)
phi = lf.phi(absolute_mag)

fig, ax = plt.subplots(figsize=(7.2, 5.0))
ax.plot(
    absolute_mag,
    phi,
    lw=3,
    color=cmr.take_cmap_colors("cmr.guppy", 3, cmap_range=(0.0, 0.2))[1],
)

secax = ax.secondary_xaxis(
    "top",
    functions=(
        lambda absolute_mag: lf.magnitudes.apparent_from_luminosity_distance(
            absolute_mag,
            luminosity_distance_mpc,
        ),
        lambda apparent_mag: lf.magnitudes.absolute_from_luminosity_distance(
            apparent_mag,
            luminosity_distance_mpc,
        ),
    ),
)

ax.set_yscale("log")
ax.invert_xaxis()
ax.set_xlabel("Absolute magnitude $M$", fontsize=LABEL_SIZE)
ax.set_ylabel(
    r"$\Phi(M)$ [$\mathrm{Mpc}^{-3}\,\mathrm{mag}^{-1}$]",
    fontsize=LABEL_SIZE,
)
ax.set_title("Schechter luminosity function", fontsize=TITLE_SIZE, pad=0.5)
ax.tick_params(axis="both", labelsize=TICK_SIZE)

secax.set_xlabel("Apparent magnitude $m$", fontsize=LABEL_SIZE)
secax.tick_params(axis="x", labelsize=TICK_SIZE)

plt.tight_layout()
(png)

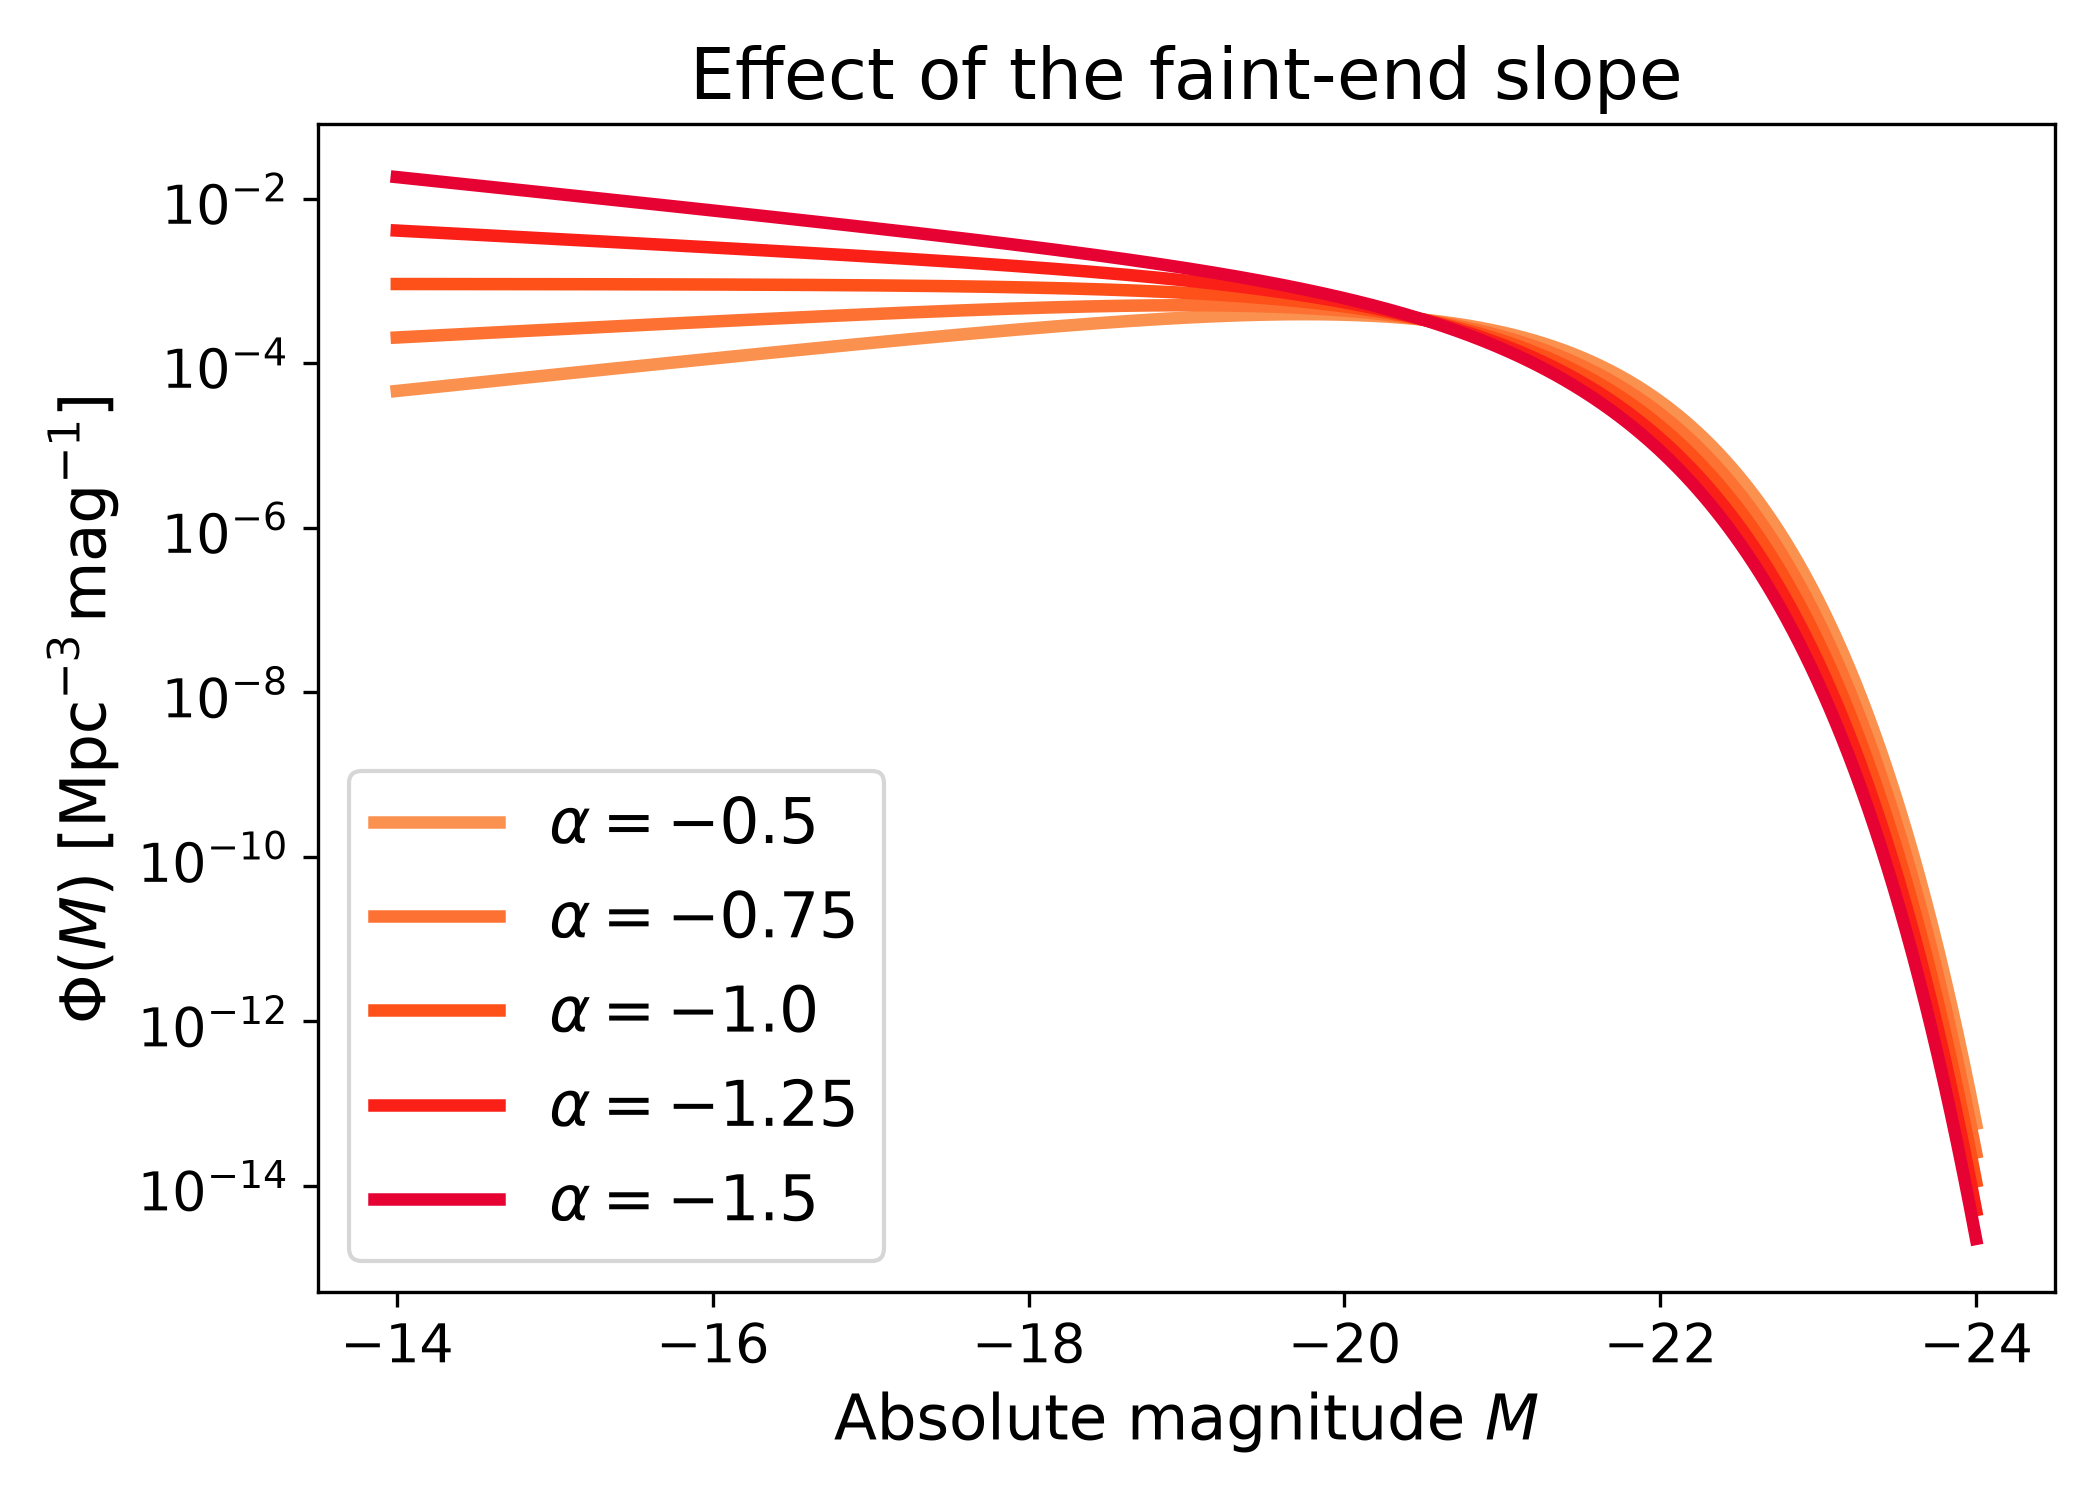
Comparing Schechter slopes#
Changing \(\alpha\) modifies the faint-end behaviour of the luminosity function. More negative values of \(\alpha\) produce a steeper rise toward faint magnitudes.
import numpy as np
import matplotlib.pyplot as plt
import cmasher as cmr

from lfkit import LuminosityFunction

LABEL_SIZE = 15
TICK_SIZE = 13
TITLE_SIZE = 17
LEGEND_SIZE = 15

absolute_mag = np.linspace(-24.0, -14.0, 500)
alphas = [-0.5, -0.75, -1.0, -1.25, -1.5]
colors = cmr.take_cmap_colors("cmr.guppy", len(alphas), cmap_range=(0.0, 0.2))

fig, ax = plt.subplots(figsize=(7.0, 5.0))

for alpha, color in zip(alphas, colors):
    lf = LuminosityFunction.schechter(
        phi_star=1.0e-3,
        m_star=-20.5,
        alpha=alpha,
    )
    ax.plot(
        absolute_mag,
        lf.phi(absolute_mag),
        lw=3,
        color=color,
        label=rf"$\alpha={alpha}$",
    )

ax.set_yscale("log")
ax.invert_xaxis()
ax.set_xlabel("Absolute magnitude $M$", fontsize=LABEL_SIZE)
ax.set_ylabel(
    r"$\Phi(M)$ [$\mathrm{Mpc}^{-3}\,\mathrm{mag}^{-1}$]",
    fontsize=LABEL_SIZE,
)
ax.set_title("Effect of the faint-end slope", fontsize=TITLE_SIZE)
ax.tick_params(axis="both", labelsize=TICK_SIZE)
ax.legend(frameon=True, fontsize=LEGEND_SIZE, loc="best")
plt.tight_layout()
(png)
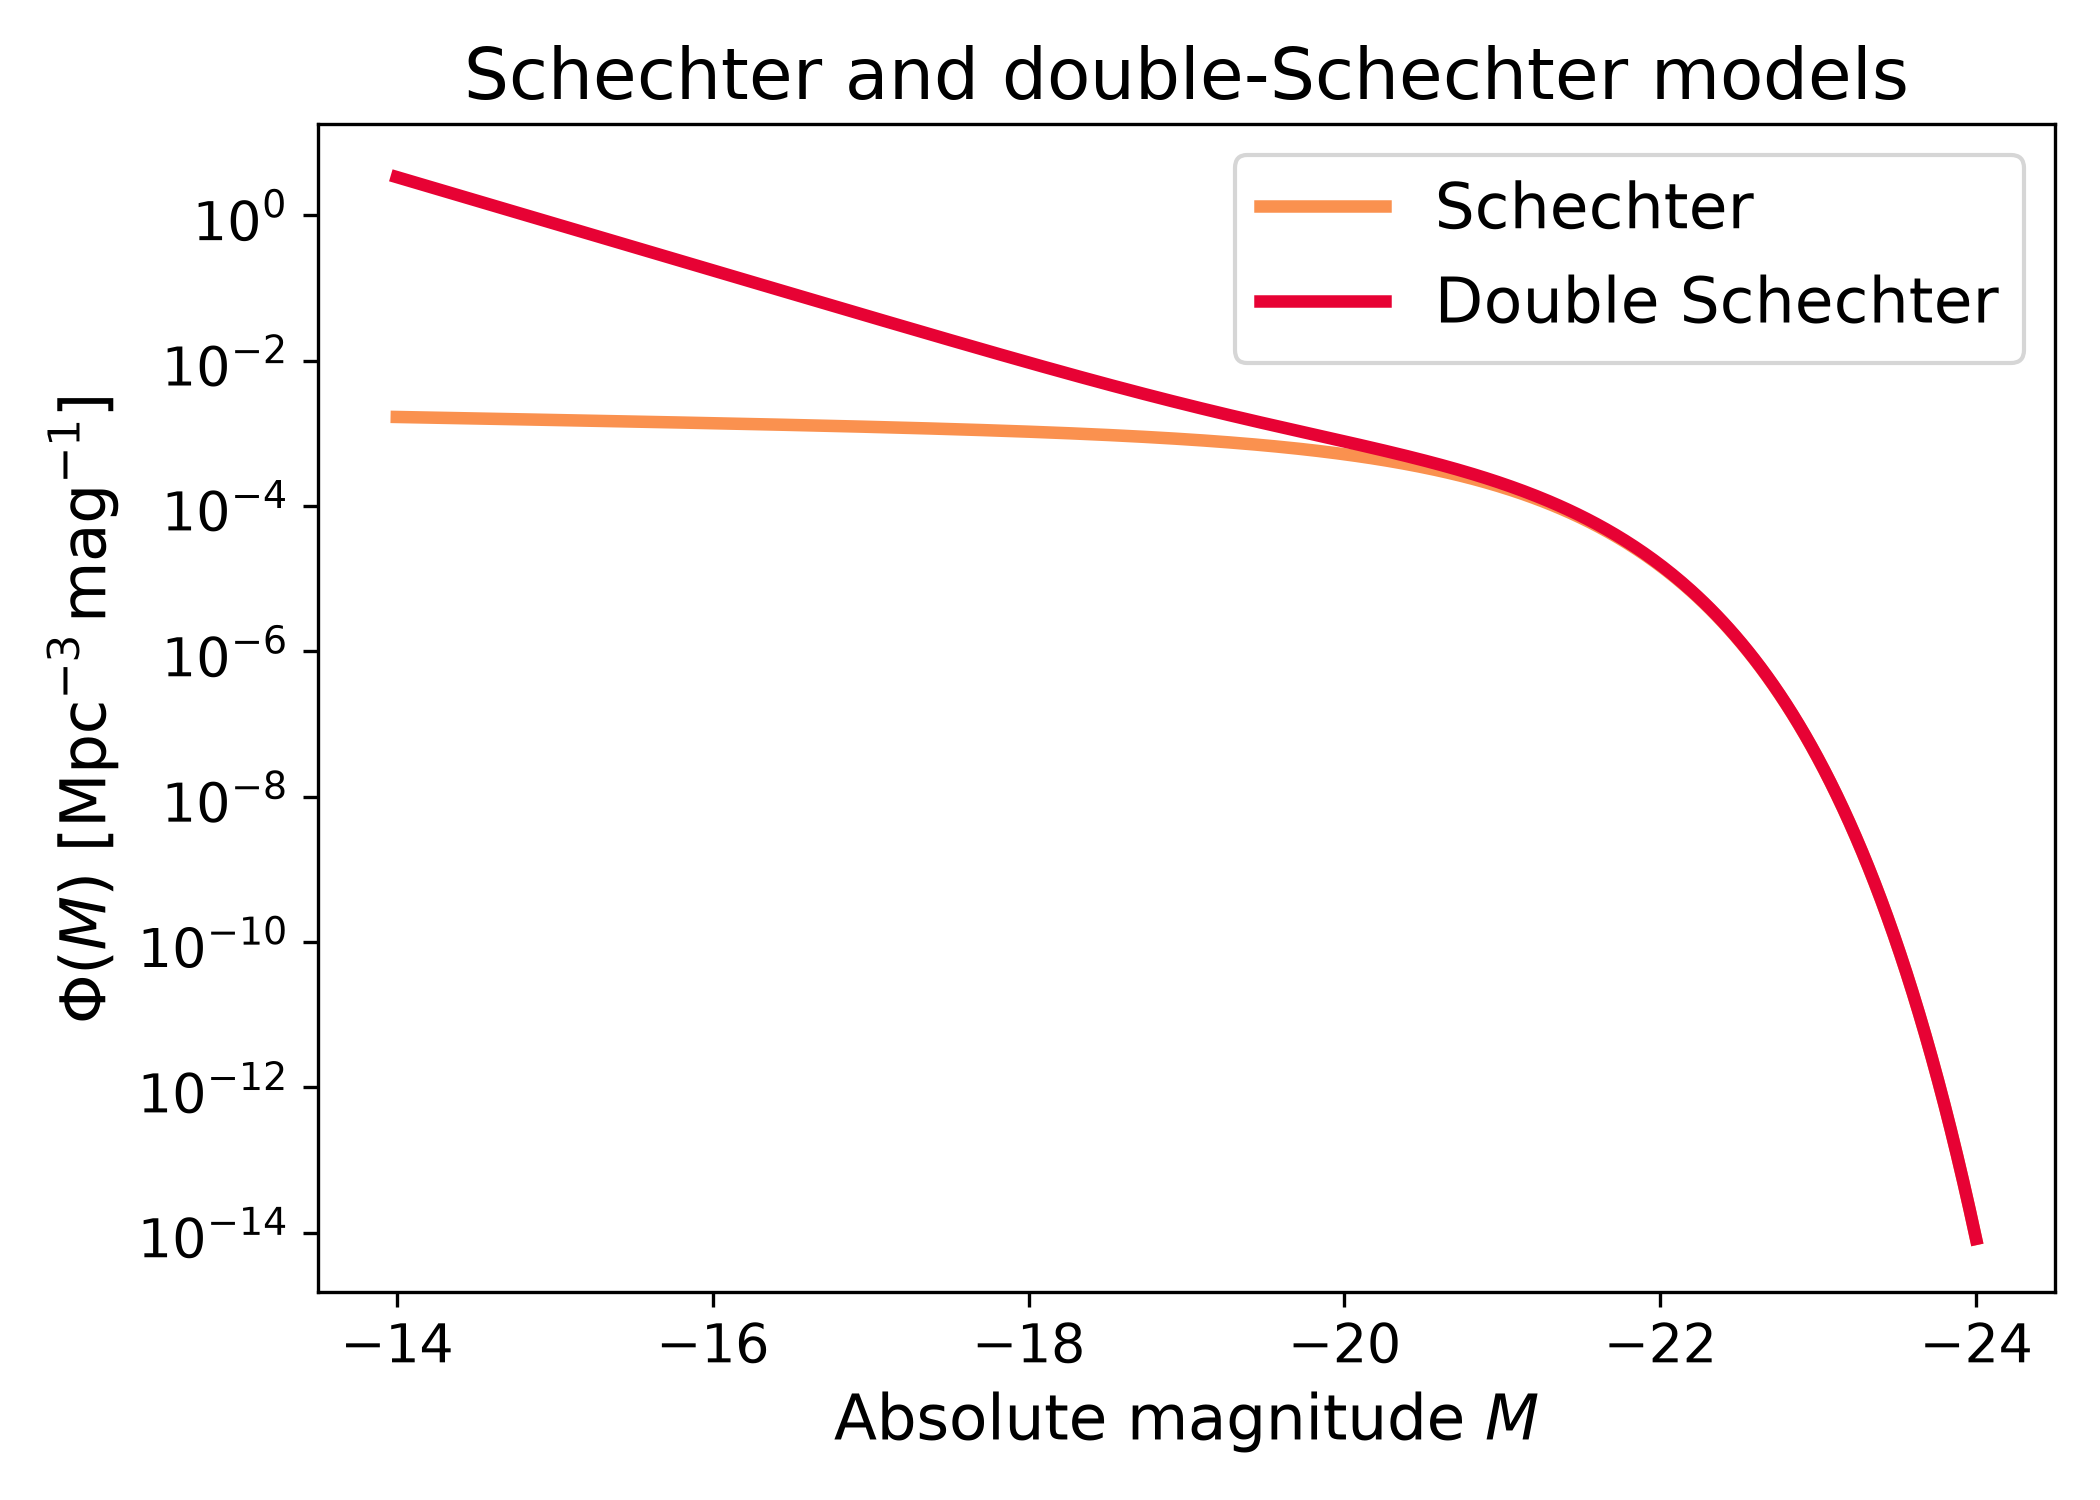
Double Schechter luminosity function#
The double-Schechter model adds a second Schechter-like component. This is useful when one faint-end slope is not flexible enough to describe the galaxy population.
import numpy as np
import matplotlib.pyplot as plt
import cmasher as cmr

from lfkit import LuminosityFunction

LABEL_SIZE = 15
TICK_SIZE = 13
TITLE_SIZE = 17
LEGEND_SIZE = 15

single = LuminosityFunction.schechter(
    phi_star=1.0e-3,
    m_star=-20.5,
    alpha=-1.1,
)

double = LuminosityFunction.double_schechter(
    phi_star=1.0e-3,
    m_star=-20.5,
    alpha=-1.1,
    beta=-1.5,
    m_transition=-19.5,
)

absolute_mag = np.linspace(-24.0, -14.0, 500)
colors = cmr.take_cmap_colors("cmr.guppy", 2, cmap_range=(0.0, 0.2))

fig, ax = plt.subplots(figsize=(7.0, 5.0))
ax.plot(
    absolute_mag,
    single.phi(absolute_mag),
    lw=3,
    color=colors[0],
    label="Schechter",
)
ax.plot(
    absolute_mag,
    double.phi(absolute_mag),
    lw=3,
    color=colors[1],
    label="Double Schechter",
)

ax.set_yscale("log")
ax.invert_xaxis()
ax.set_xlabel("Absolute magnitude $M$", fontsize=LABEL_SIZE)
ax.set_ylabel(
    r"$\Phi(M)$ [$\mathrm{Mpc}^{-3}\,\mathrm{mag}^{-1}$]",
    fontsize=LABEL_SIZE,
)
ax.set_title("Schechter and double-Schechter models", fontsize=TITLE_SIZE)
ax.tick_params(axis="both", labelsize=TICK_SIZE)
ax.legend(frameon=True, fontsize=LEGEND_SIZE, loc="best")
plt.tight_layout()
(png)

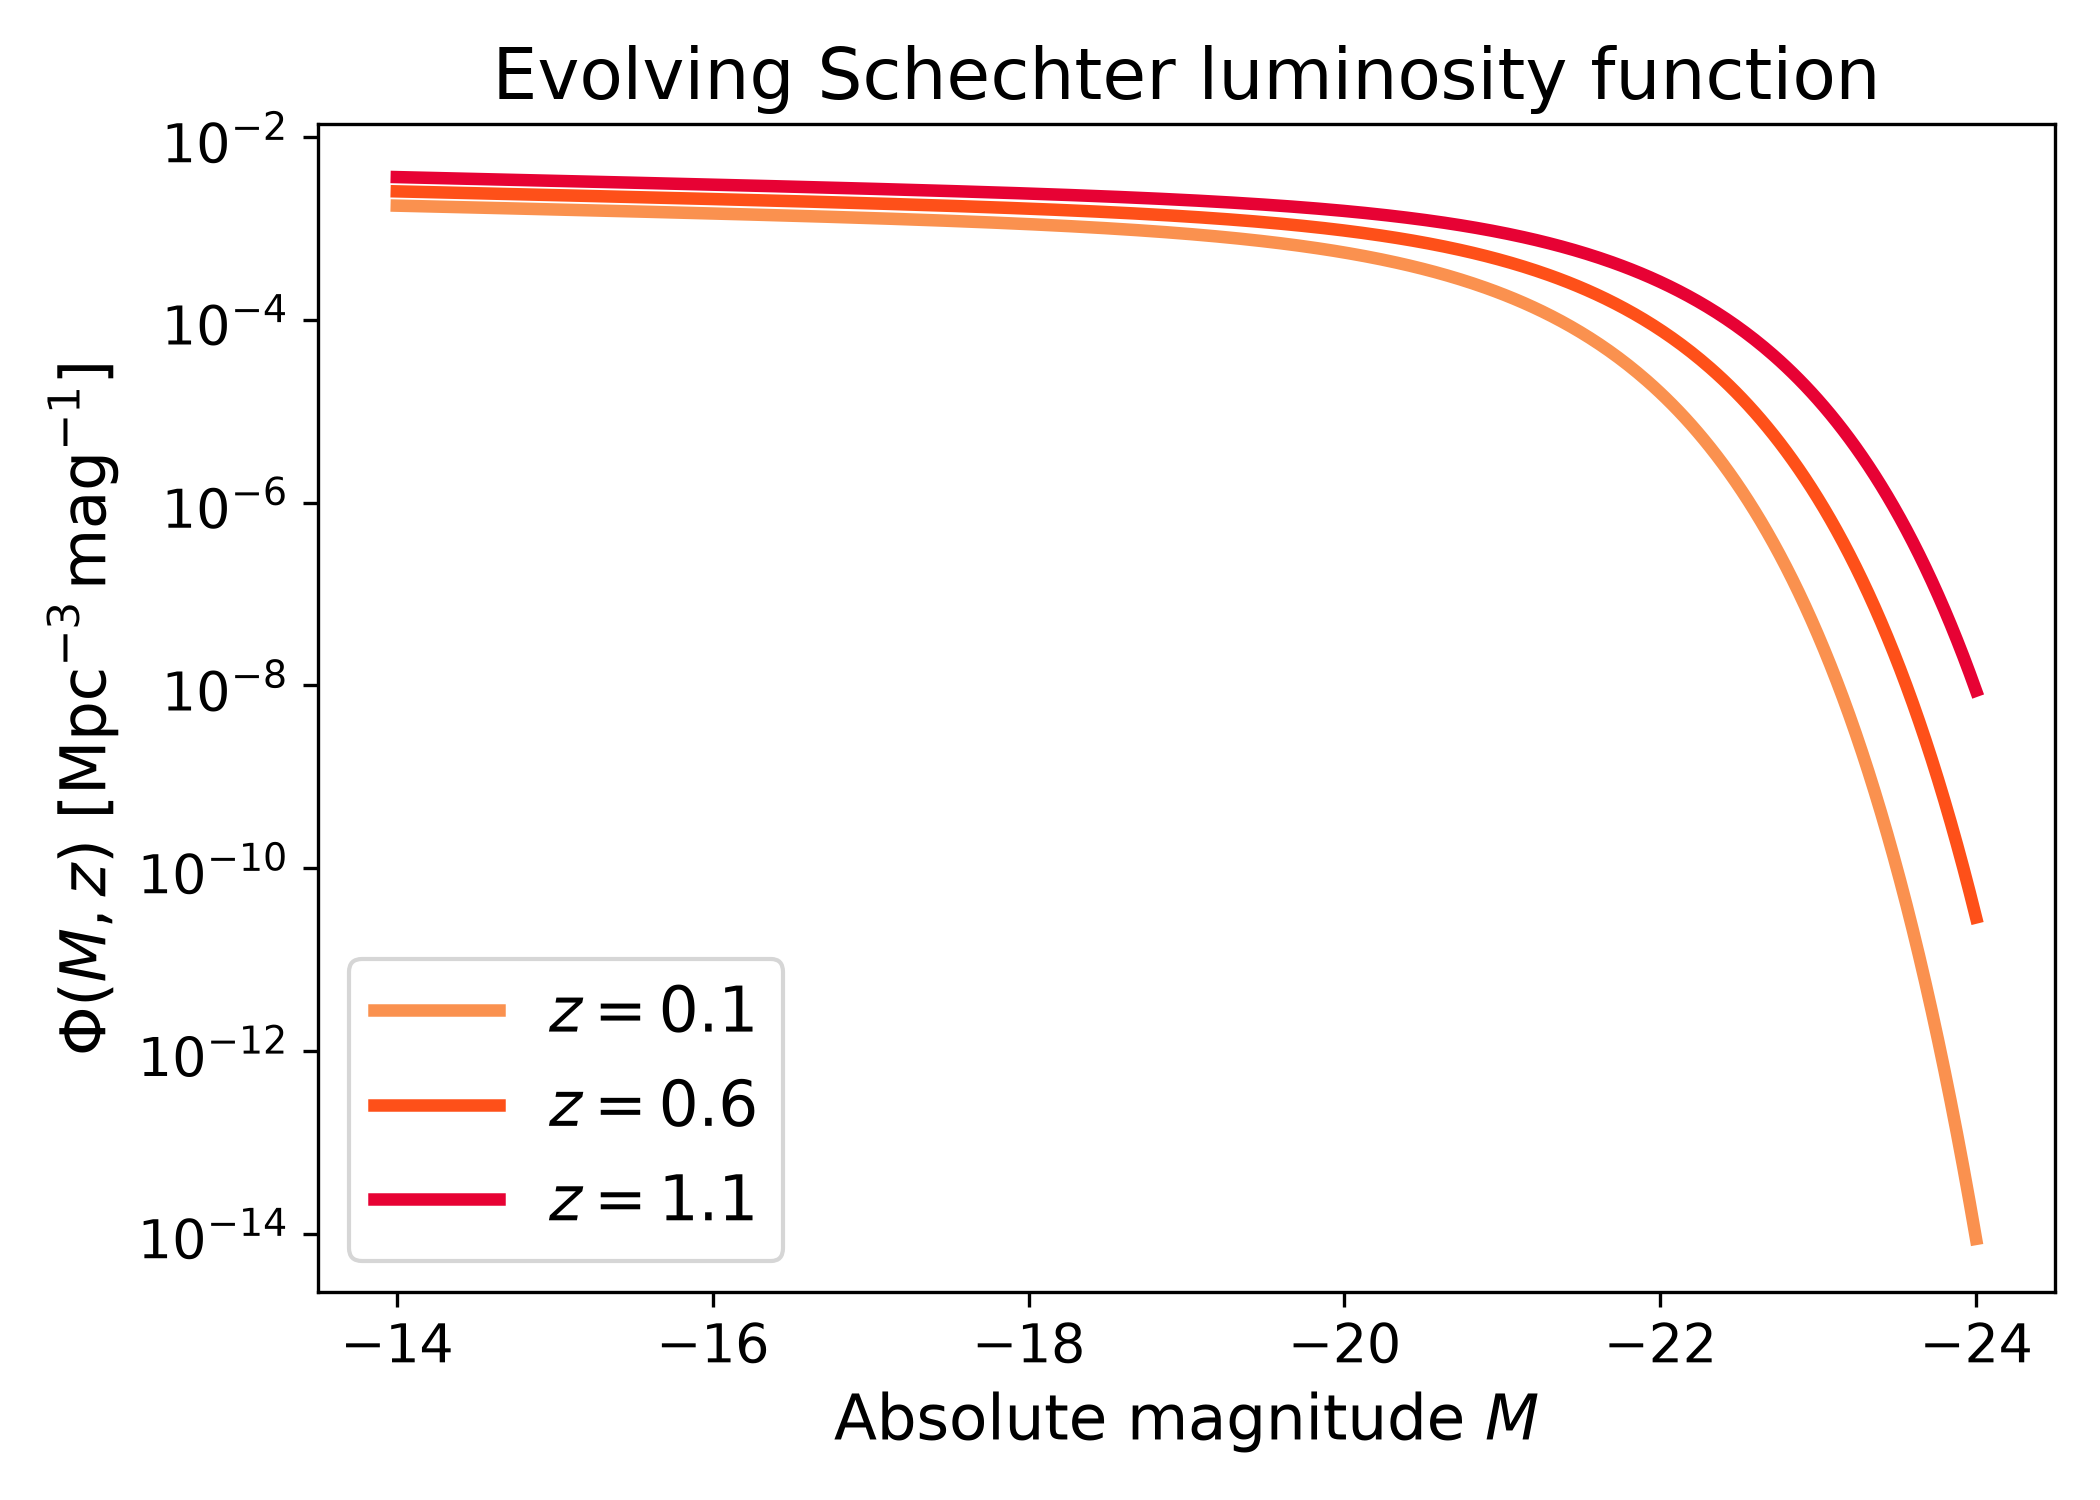
Evolving Schechter luminosity function#
An evolving Schechter luminosity function lets the Schechter parameters depend on redshift through LFKit’s registered parameter models.
import numpy as np
import matplotlib.pyplot as plt
import cmasher as cmr

from lfkit import LuminosityFunction

LABEL_SIZE = 15
TICK_SIZE = 13
TITLE_SIZE = 17
LEGEND_SIZE = 15

lf = LuminosityFunction.evolving_schechter(
    phi_model="linear_p",
    phi_kwargs={"phi_0_star": 1.0e-3, "p": 0.7},
    m_star_model="linear_q",
    m_star_kwargs={"m_0_star": -20.5, "q": 0.8, "z_ref": 0.1},
    alpha_model="constant",
    alpha_kwargs={"alpha": -1.1},
)

absolute_mag = np.linspace(-24.0, -14.0, 500)
redshifts = [0.1, 0.6, 1.1]
colors = cmr.take_cmap_colors("cmr.guppy", len(redshifts), cmap_range=(0.0, 0.2))

fig, ax = plt.subplots(figsize=(7.0, 5.0))

for z_value, color in zip(redshifts, colors):
    ax.plot(
        absolute_mag,
        lf.phi(absolute_mag, z_value),
        lw=3,
        color=color,
        label=rf"$z={z_value}$",
    )

ax.set_yscale("log")
ax.invert_xaxis()
ax.set_xlabel("Absolute magnitude $M$", fontsize=LABEL_SIZE)
ax.set_ylabel(
    r"$\Phi(M, z)$ [$\mathrm{Mpc}^{-3}\,\mathrm{mag}^{-1}$]",
    fontsize=LABEL_SIZE,
)
ax.set_title("Evolving Schechter luminosity function", fontsize=TITLE_SIZE)
ax.tick_params(axis="both", labelsize=TICK_SIZE)
ax.legend(frameon=True, fontsize=LEGEND_SIZE, loc="best")
plt.tight_layout()
(png)